Official figures show that air pollution has reduced right across Newcastle in the first year of the city centre Clean Air Zone (CAZ). On average air pollution readings are 16% lower compared to 2021 and 2022, with only a few remaining locations over legal limits. Not only that, air quality has improved both within the CAZ and right across the city. Concerns that pollution would increase outside the CAZ have proved to be unfounded.
Overall this, and similar outcomes at other cities around the UK, are a great advert for Councils that are willing to listen to the evidence, make the case and take bold decisions to protect their residents from dangerous air pollution and other harms.
All but one of the air pollution sensors across Newcastle showed a drop in nitrogen dioxide levels from 2022 to 2023, the first year in which the Clean Air Zone tolls came into force https://t.co/RIvid2uNL9
— The Journal (@TheJournalNews) July 10, 2024
2023 Highlights:
- The Clean Air Zone (CAZ) came into force at the end of January 2023, with non-compliant taxis, private hire vehicles, buses, coaches and HGVs being charged from 30 January 2023, and vans and light goods vehicles charged from July 2023.
- In 2023, following the introduction of the CAZ, only five locations recorded readings higher than the legal maximum, and only two (Percy Street and on The Coast Road) were greater than 10% over the limit for Nitrogen Dioxide pollution. By contrast, in 2019, forty eight different monitors recorded air pollution over the legal limit.
- Percy Street (45.9μg/m3), St Mary’s Place (42.2μg/m3), Blackett Street (40.9μg/m3) and Market Street (42.2μg/m3) were the only city centre locations over the legal limit.
- The worst pollution recorded across all Newcastle was 67μg/m3 (down from 92.2 μg/m3 in 2022). This was on The Coast Road by the junction with Jesmond Park West, the same location as 2021 and 2022. No other locations outside the city centre were over the legal limit.
- Pollution reduced right across the Newcastle upon Tyne local authority area suggesting fears of increased pollution in areas surrounding the CAZ were unfounded.
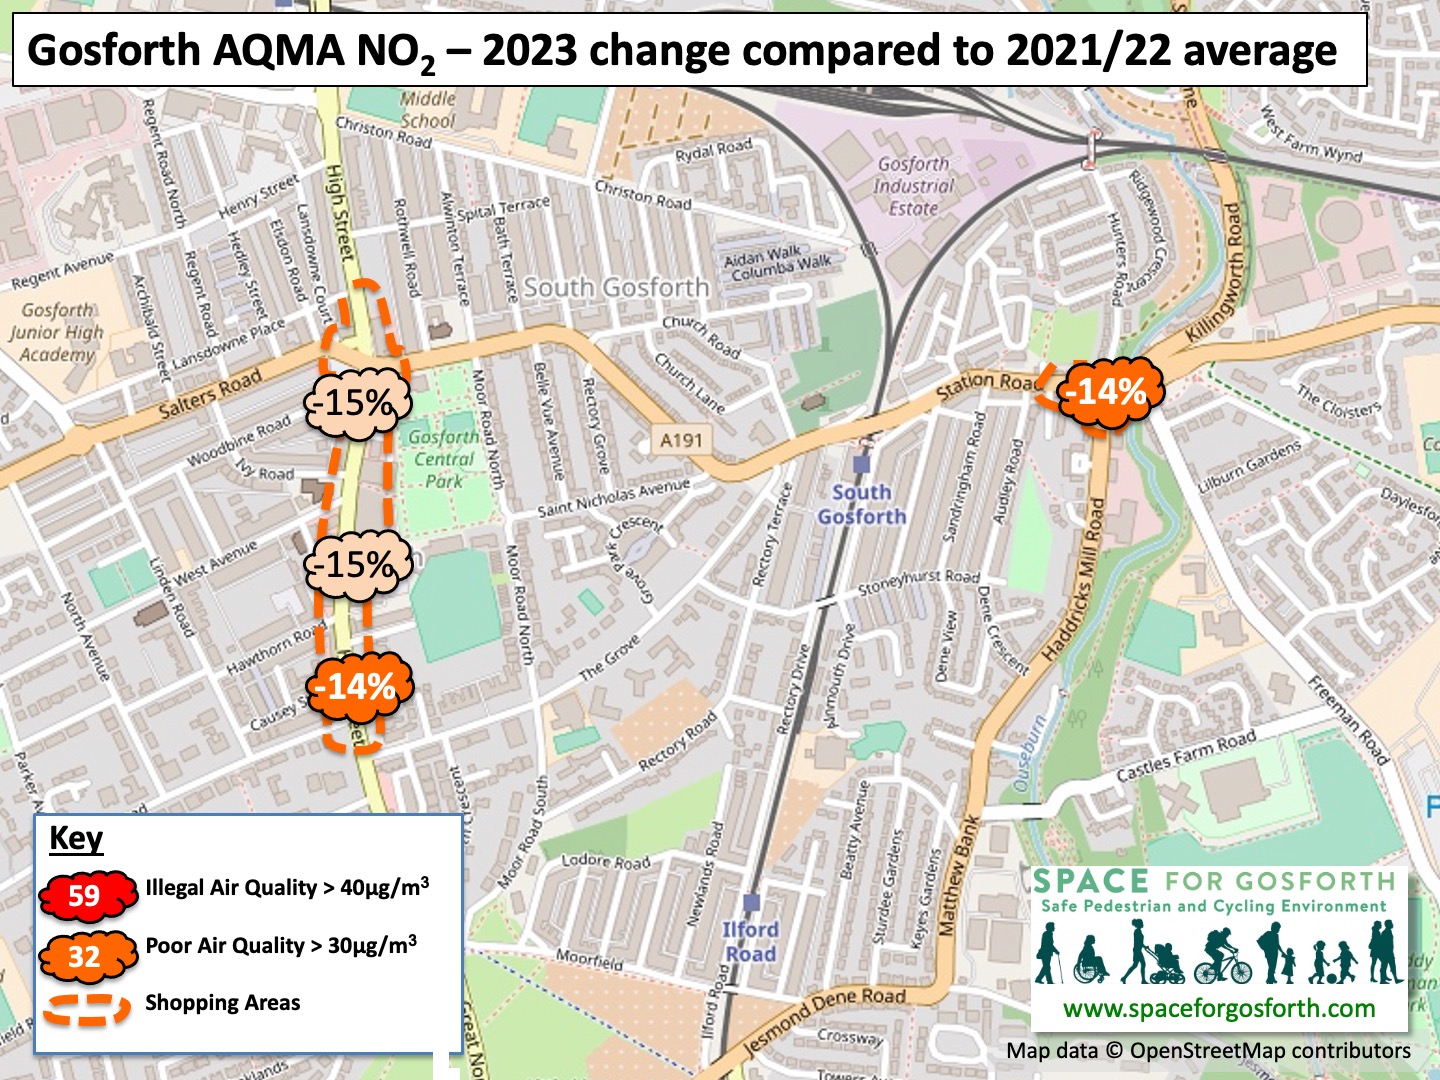
- Measurements from Gosforth were all within UK legal limits for the fourth year running, with reductions of approximately 15% at all five monitored locations covering Blue House, Haddricks Mill roundabout and Gosforth High Street.
Note that roads works on the Tyne Bridge will not have impacted these figures as they started in January 2024 and the pollution data is for 2023.
Newcastle City Centre
Visitors, workers and residents in Newcastle city centre can now breathe a bit more easily, while predictions that the CAZ would turn the city into a ‘ghost town’ have been proved to be nonsense.
In the city centre, Percy Street by Haymarket was the most polluted location with a Nitrogen Dioxide (NO2) reading of 45.9μg/m3, a decrease of 12% compared to 2022, one of four city centre locations still above the 40μg/m3 legal maximum for the UK.
The two maps below show air pollution measurements in the city centre and the percentage change compared to an average of 2021 and 2022 readings.
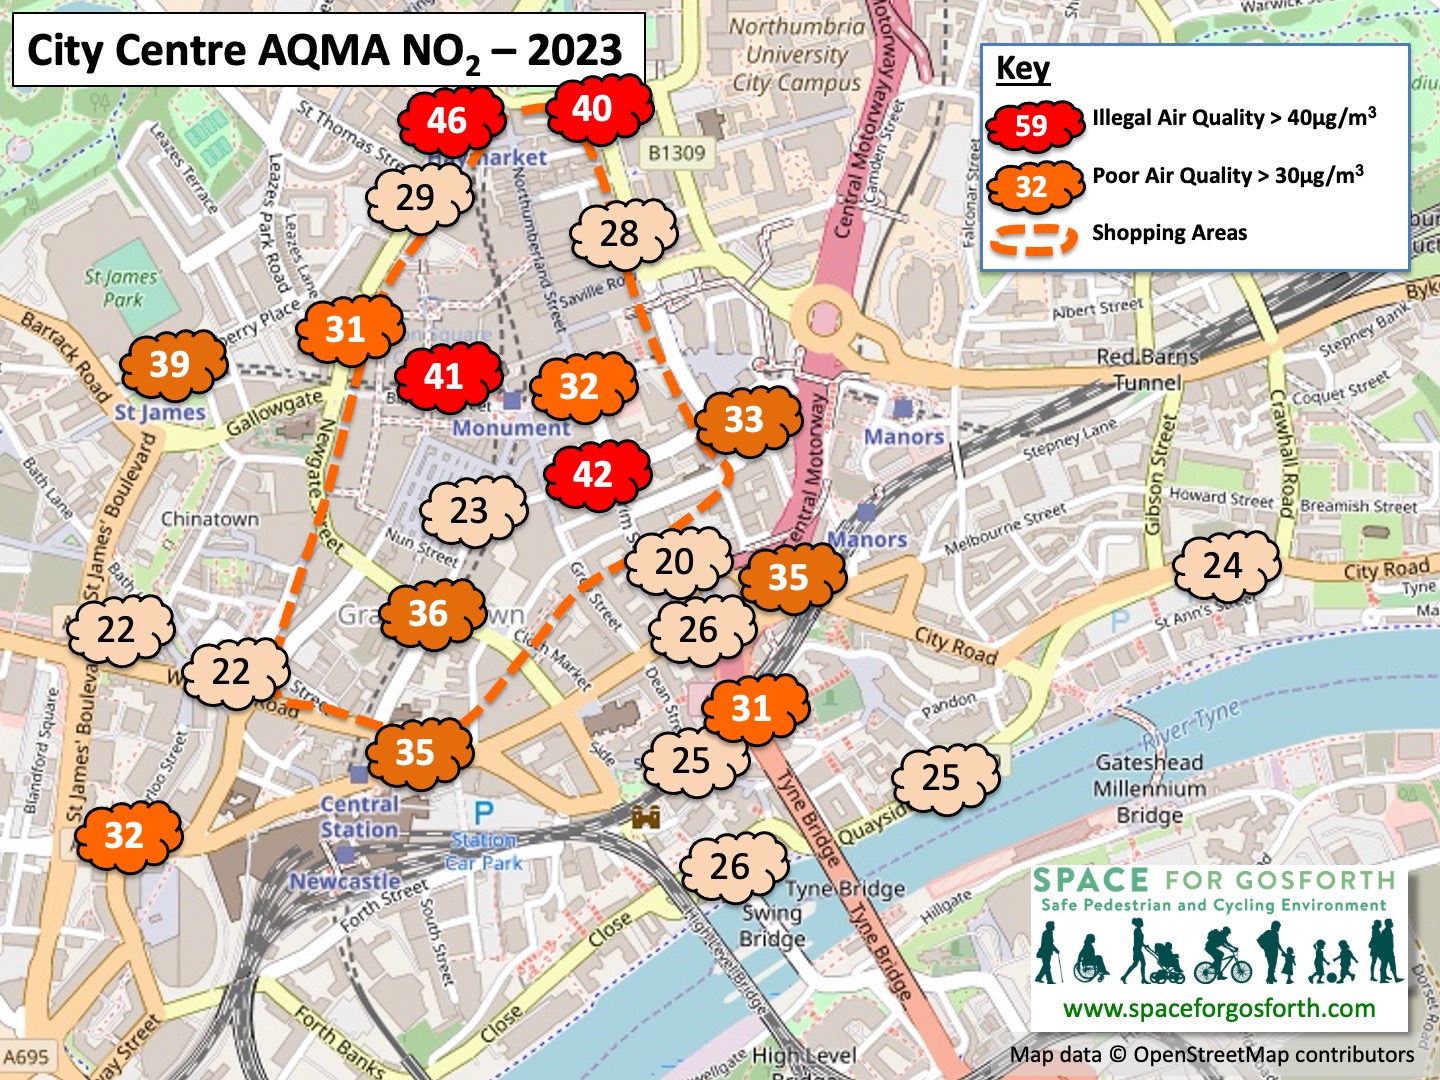
City Centre Air Quality Management Area (AQMA) NO2 readings
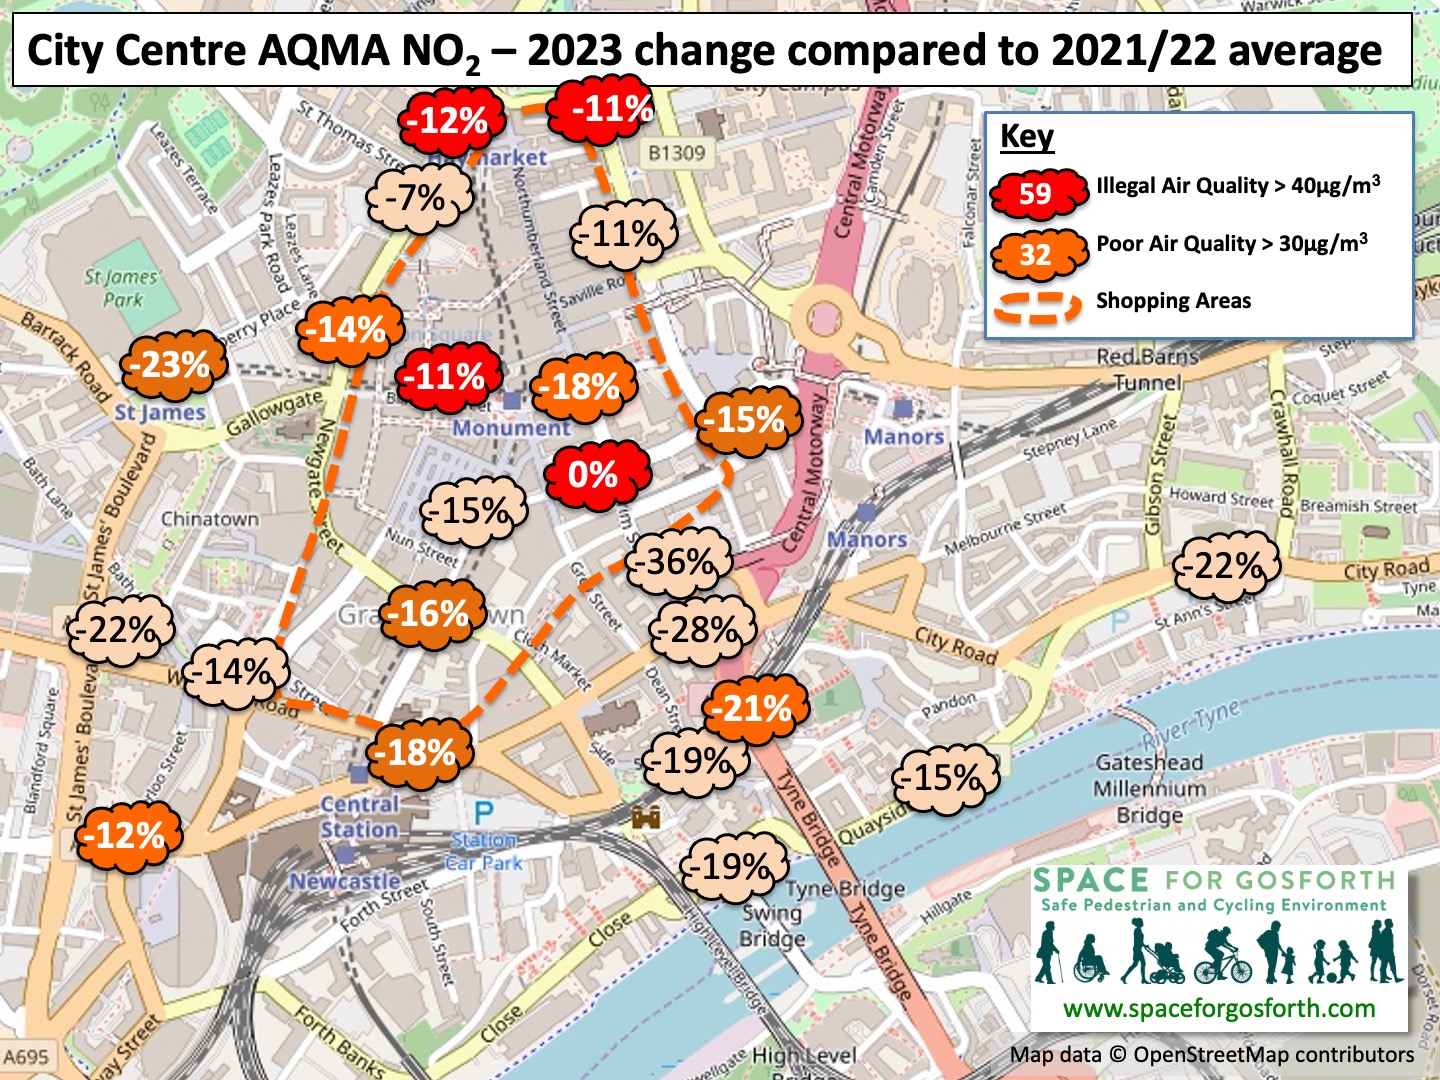
City Centre Air Quality Management Area (AQMA) Change in NO2 readings
Four locations in the city centre exceeded legal limits in 2023
- 45.9 μg/m3 (down from 53.3 μg/m3 in 2022) DT29/DT30/DT31 (triplicate co-location site, Percy Street)
- 42.2 μg/m3 (down from 44.7 μg/m3 in 2022) DT8 (Market Street)
- 40.9 μg/m3 (down from 46.6 μg/m3 in 2022) DT65 (Blackett Street/Old Eldon Square)
- 40.5 μg/m3 (down from 46.3μg/m3 in 2022) St Marys Place/John Dobson Street (DT5, DT115,DT116)
Air pollution levels on Mosley Street, Stephenson Road, Strawberry Place, John Dobson Street, Neville Street/Westgate Road were all within legal limits in 2023.
The biggest drop in air pollution anywhere in the city was -36% on Pilgrim Street, most likely due to traffic restrictions for nearby building works.
In 2019 (pre-Covid), Blackett Street was the most polluted location in the city centre with a measurement of 71μg/m3.

Air pollution on Blackett Street in 2023, including from buses, was just above the legal limit, measured at 40.9μg/m3.
PM2.5, very small particulate matter pollution, is also measured in the city centre at the Civic Centre. In 2023 the reading was 6.3μg/m3 (broadly unchanged from 6.5μg/m3 in 2022) which is less than the UK Legal limit 20μg/m3, but higher than WHO guidance that the annual average should be no more than 5μg/m3, which Newcastle City Council has committed to achieve by 2030.
The Government estimates that most PM emissions from road transport are non-exhaust emissions (brake, tyre and road wear), contributing 15% of total PM2.5 emissions. 29% of total PM2.5 emissions is estimated to come from wood-burning stoves and other ‘domestic combustion’.
Air pollution appears to have fallen across much of a city in the first year of its Clean Air Zone (CAZ) tolls, according to council data. https://t.co/VX1KKdCat9
— BBC North East (@BBCNEandCumbria) July 10, 2024
Central Motorway and Coast Road
The Council’s pollution plan analysis from 2019 was that air quality on The Coast Road would be compliant by 2021 and that no additional measures would be required.
In 2023, following introduction of the CAZ, substantial reductions in air pollution were recorded on The Coast Road, up to 29% in two locations. Despite that the reading by Jesmond Park West remains stubbornly high.
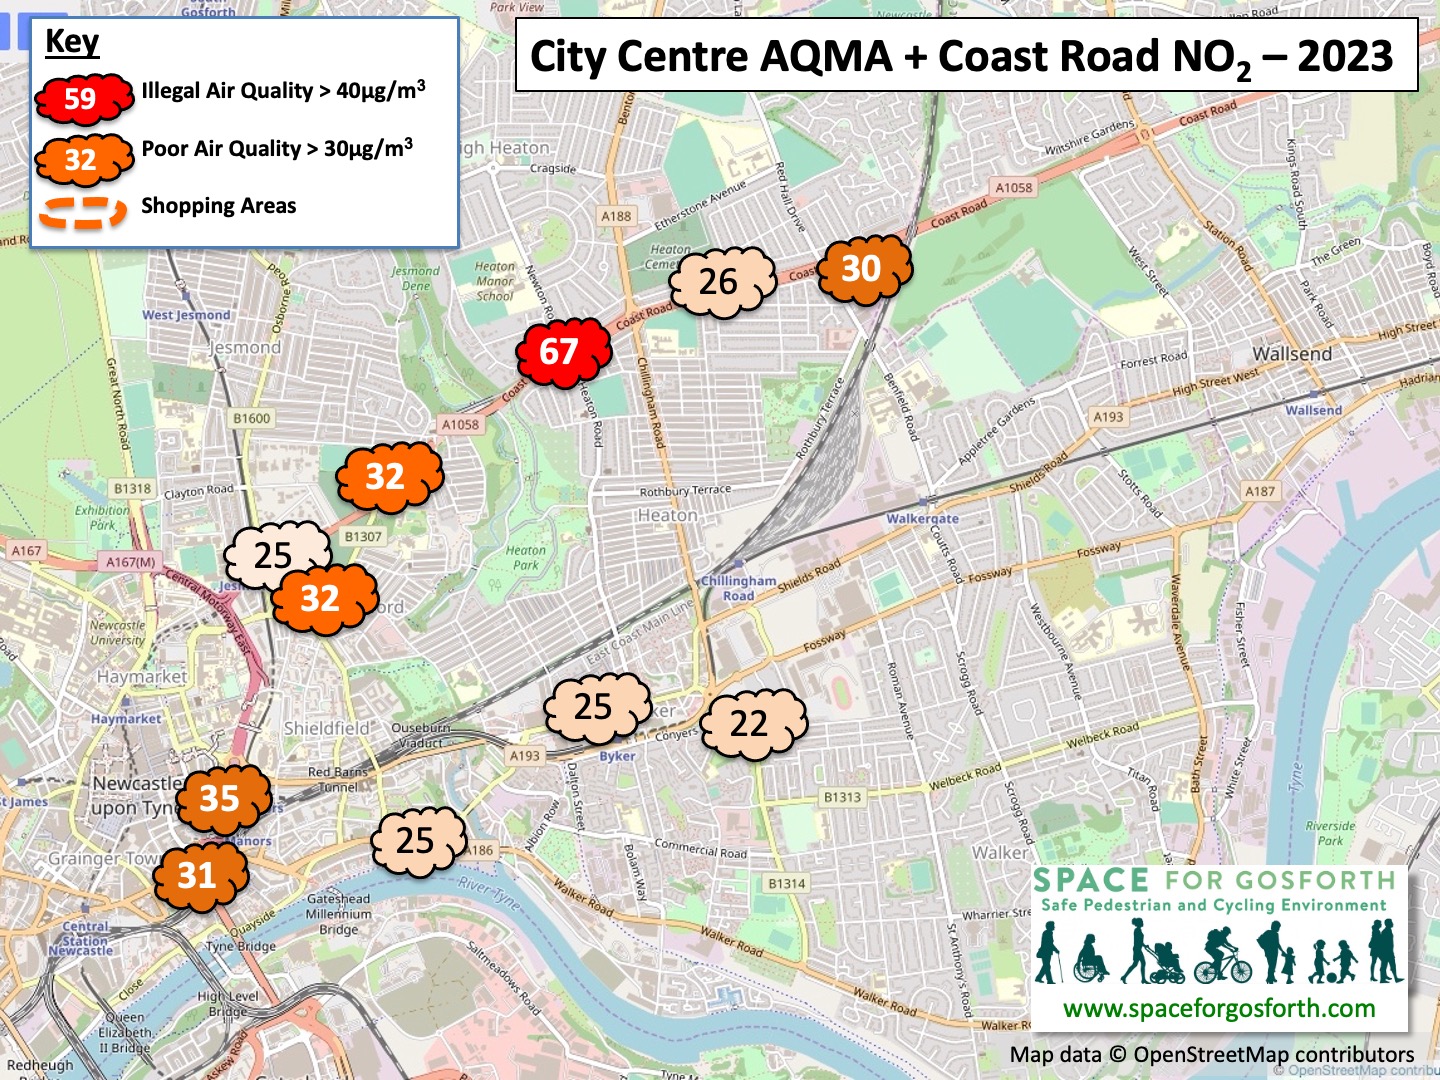
City Centre AQMA and Coast Road NO2 in 2023
Pollution reduced at all monitors along the A1058, including on Jesmond Road on the boundary of the now removed Jesmond LTN, which was in place from April 2023 to January 2024.

City Centre AQMA and Coast Road Change in NO2 readings
There was only one Coast Road location where air pollution exceeded the legal limit in 2023
- 67.1μg/m3 (down from 92.2 μg/m3 in 2022) DT81 (Stephenson Road, entrance to Jesmond Park West)
Traffic levels also reduced here from 50,111 average vehicles daily in 2022 to 48,067 in 2023. This may explain the greater reduction on the Coast Road compared to other parts of the city. This reduction in traffic may be related to the Jesmond Low Traffic Neighbourhood – we will be watching in 2024 to see if traffic will increase again following its removal.
Gosforth
In 2023, all Gosforth monitors recorded pollution levels within legal limits. Pollution on Gosforth High Street, which has been within legal limits since it became one lane in each direction, was the least polluted we’ve seen other than in 2020.
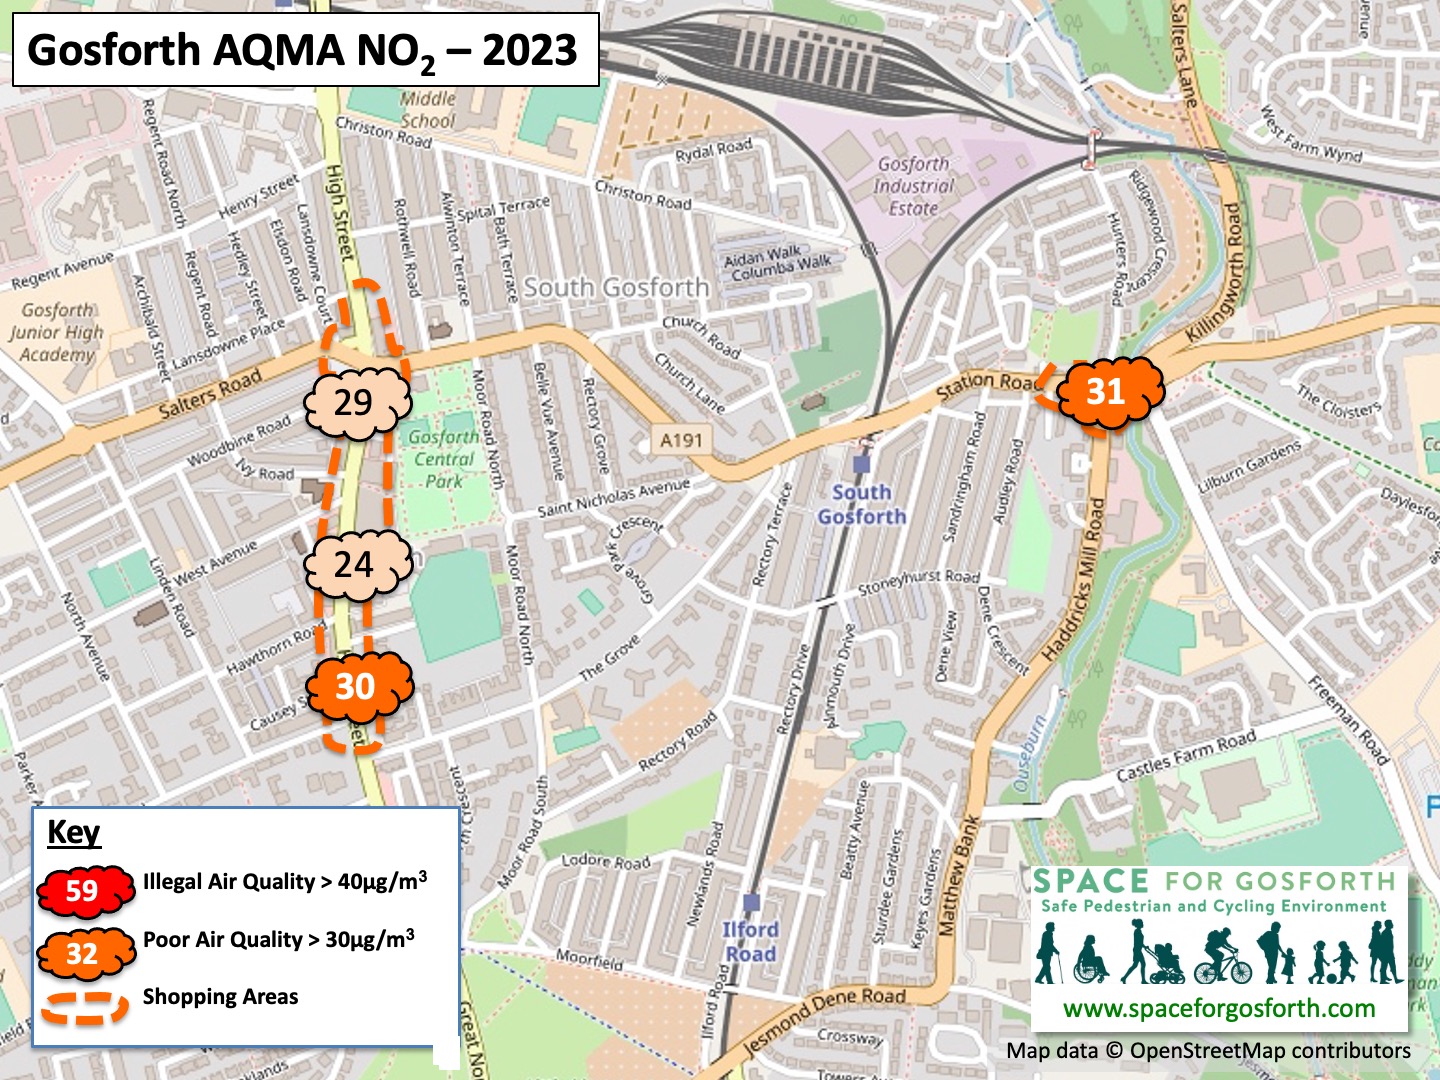
Gosforth Air Quality Management Area (AQMA)
Gosforth will have benefited from the CAZ as approximately 6% of traffic on Gosforth High Street are buses and HGVs, and a further 6% are heavy vans, many of which will have been making journeys into or through the city centre CAZ.
Gosforth Air Quality Management Area (AQMA)
Gosforth Air Quality Management Area (AQMA) Change in NO2 readings
The four pollution measurements shown in Gosforth (all within UK legal limits) are:
- 35.5μg/m3, DT50 (84 Station Road)
- 33.8μg/m3, DT43 (53 High Street, Gosforth)
- 27.3μg/m3, DT44 (102 – 104 High Street, Gosforth)
- 36.4μg/m3, DT45 (201 Gosforth High St)
The graph below, updated for 2023, shows that air pollution at the three High Street monitoring sites and average daily traffic measured just north of The Grove are clearly linked. Because of this, doing anything that increases vehicle capacity on Gosforth High Street, including returning to the pre-Covid layout, would potentially be in violation of the Air Quality Regulations.
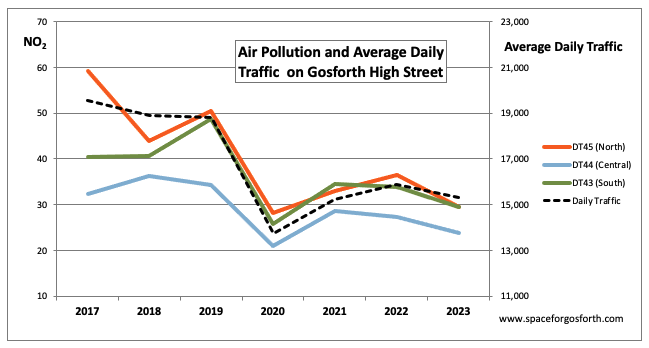
Air pollution and average daily traffic on Gosforth High Street
Denton Burn
All the readings west of the city were also within legal limits. Air pollution at Cowgate roundabout, which was over the limit in 2022, reduced by 34%. This and other measurements west of the city suggest fears that traffic would be rerouted away from the city centre were unfounded.
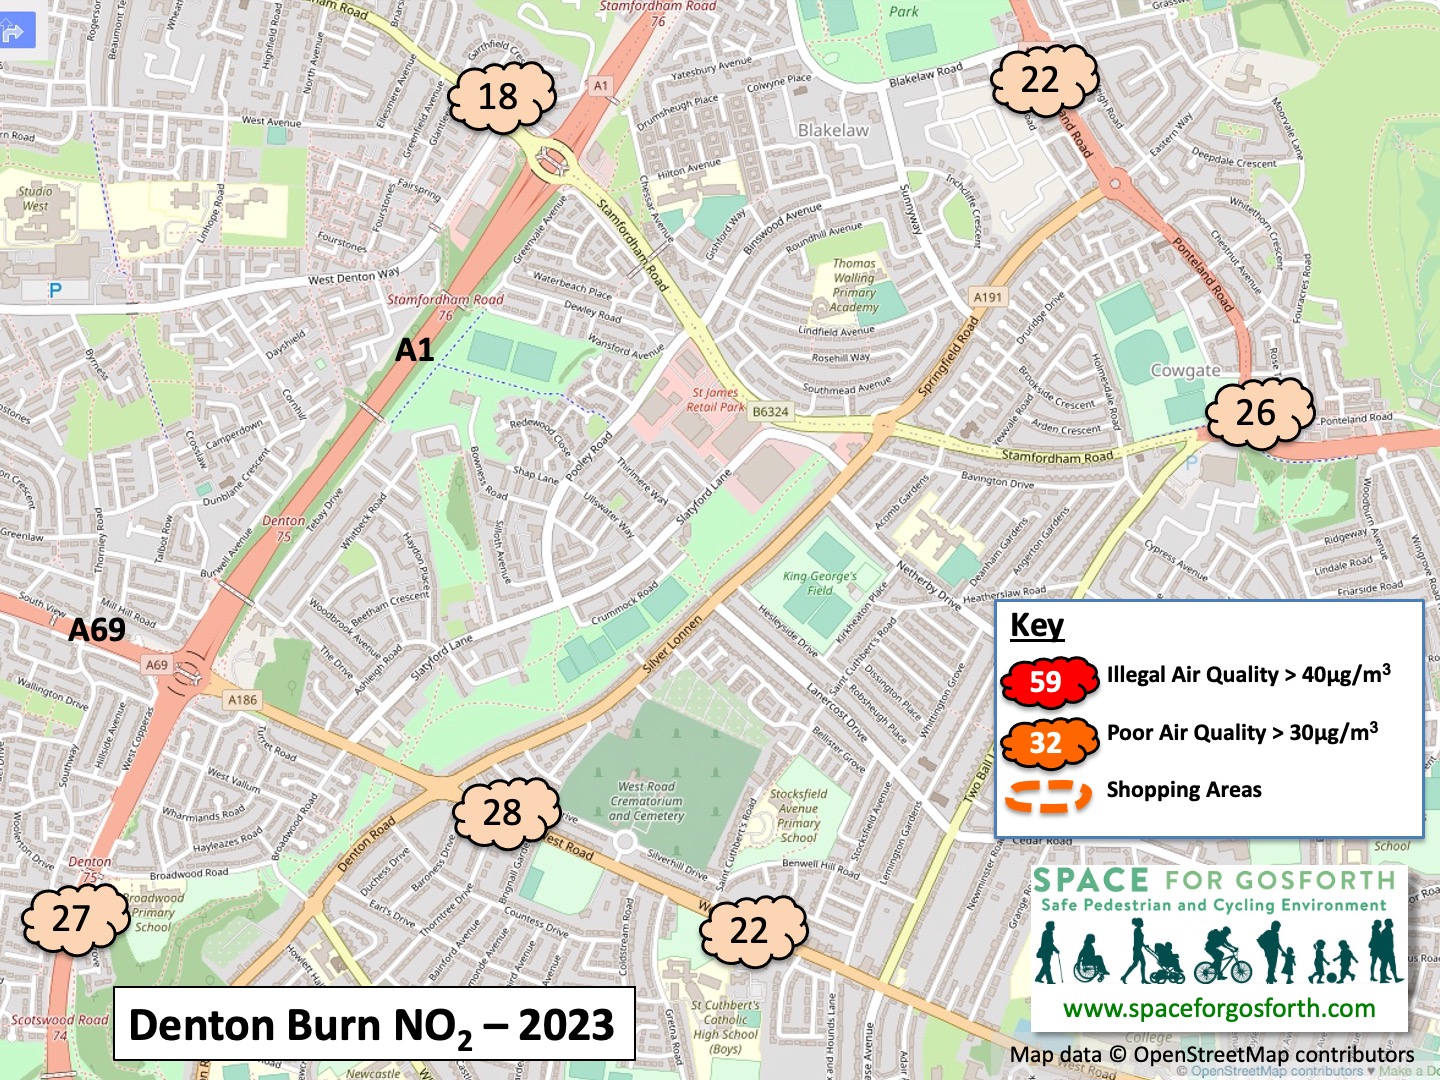
Denton Burn air pollution readings
Only one monitor increased from 2022 to 2023 and that was only a very slight change. This was at the A1 south of the A69 junction where the 2023 reading was 26.5μg/m3, up from 25.9μg/m3 in 2022 but still less than 2021 when the reading was 26.8μg/m3.
The lack of a decrease at this location may be due to additional traffic caused by induced demand from the A1 Scotswood to North Brunton road widening, which was completed 10 October 2022.
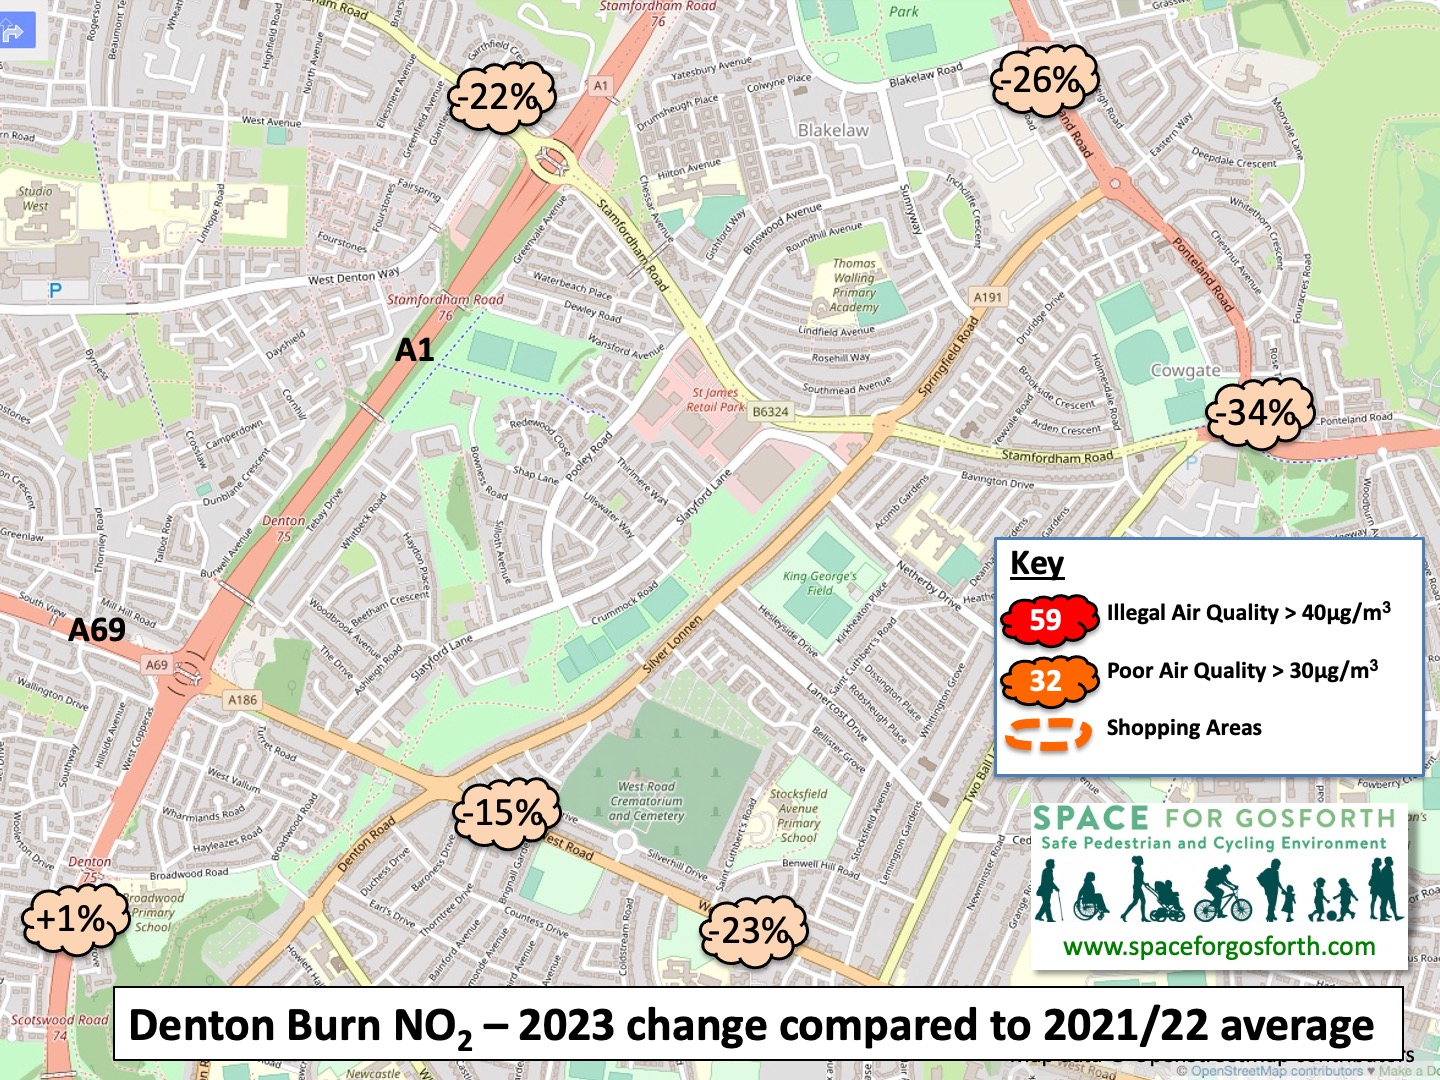
Denton Burn change in air pollution readings
The Clean Air Zone
When SPACE for Gosforth published its review of the Council’s final CAZ plans in 2019 we said Newcastle’s final air pollution plan has been watered down with no measures planned until 2021. Our assessment was calibrated against the 2016 UK High Court ruling that required the Secretary of State to “achieve compliance by the soonest date possible, that she must choose a route to that objective which reduces exposure as quickly as possible, and that she must take steps which mean meeting the value limits is not just possible, but likely.“
We stand by our assessment that limits could have been met sooner, and we are still waiting for the Council to set out how they will achieve the legal limit by Jesmond Park West.
We also stand by our assessment that the CAZ alone, though necessary, would not have been sufficient to meet air quality limits by 2020/2021. Other factors have also played a part in meeting air quality limits in 2023, including:
- Fewer petrol and diesel vehicles as they are replaced by EVs.
- The impact of the Covid pandemic on travel patterns.
- Removal of free driving incentives like Alive After 5.
- The reduction in traffic on Gosforth High Street since it was changed to be single-lane in each direction.
While the first of these is unlikely to be reversed, the other factors could be. The Council needs to ensure that it takes steps to prevent air pollution increasing again.
That said, eighteen years after UK Air Quality Limits should have been met in Newcastle, most of the city is now within air quality legal limits.
We do not believe this would have been possible without the CAZ. This Government’s Air Quality Technical Guidance states that charging the most polluting vehicles is one of the most effective ways to reduce pollution, and this seems to have been borne out.
As we said above, this, and similar outcomes at other cities around the UK like Bath, Birmingham, Oxford and Sheffield are a great advert for Councils that are willing to listen to the evidence, make the case and take bold decisions to protect their residents from dangerous air pollution and other harms. We hope the Council will continue to prioritise reducing air pollution to meet the lower more recently updated World Health Organisation limits.
We would like to thank the Council for releasing air pollution monitoring data several month’s earlier than in previous years, allowing us to better understand the impact of the CAZ and enabling the Council to plan any further measures necessary to address pollution at the five locations still over the limit.
This is SPACE for Gosforth’s eighth annual pollution blog covering official air quality monitoring in Newcastle upon Tyne. In all seven previous years, air pollution in Newcastle exceeded legal limits.
The main pollutant of concern in Newcastle is Nitrogen Dioxide (NO2). The UK legal maximum for NO2 is 40μg/m3 (micro grams per cubic metre) averaged over a calendar year, however the World Health Organisation (WHO) recommend that NO2 should be no more than 10μg/m3 averaged over a year.
For anyone thinking that there must be a better way to cut air pollution than a Clean Air Zone, the Council’s city centre Air Quality Plan, in place since 2008, includes 38 non-CAZ actions to improve air quality. None of these other actions have had anything like the same impact as the CAZ.
SPACE for Gosforth has previously summarised official air pollution measurements for 2022, 2021, 2020, 2019, 2018, 2017 and 2016.