SPACE for Gosforth submitted evidence and feedback to several consultations in 2017. Here is our November 2017 response to the joint inquiry by the Environment Food and Rural Affairs, Environmental Audit, Health, and Transport Committees into improving air quality which was launched in October 2017. Prior to this, in July 2017, after UK courts twice ruled that the Government’s plans to cut air pollution were inadequate, the Government released a new air quality plan. The aim of the cross-party inquiry was to examine whether this new plan goes far enough, fast enough to both meet legal limits and to deliver the maximum environmental and health benefits.
The Committee invited written submissions on the following key questions:
- How effectively do Government policies take into account the health and environmental impacts of poor air quality?
- Do these plans set out effective and proportionate measures to achieve necessary emissions reductions as quickly as possible?
- Are other nations or cities taking more effective action that the UK can learn from?
- Is there enough cross-government collaboration to set in place the right fiscal and policy incentives?
- How can those charged with delivering national plans at local level be best supported and challenged?
This is the written evidence submitted by SPACE for Gosforth (IAQ0174). This submission can also be read online on the UK Parliament website.
SPACE for Gosforth Written Evidence – submitted …..add date here…..
- SPACE for Gosforth (SPACE) is a group to promote and campaign for a Safe Pedestrian And Cycling Environment for Gosforth in Newcastle upon Tyne. We are residents of Gosforth, most of us with families and we walk, cycle, use public transport and drive. We are not affiliated to any other campaign group or political party.
- The aim of the organisation is to promote healthy, liveable, accessible and safe neighbourhoods where
- Walking and cycling are safe, practical and attractive travel options for residents of all ages and abilities.
- Streets are easier and safer to navigate for residents or visitors with limited mobility and for residents or visitors with disabilities or conditions for whom travel is a challenge.
- There is good walking and cycling access to local community destinations including schools, shops, medical centres, work-places and transport hubs.
- Streets are valued as places where people live, meet and socialise, and not just for travelling through.
- The negative consequences of excessive vehicle traffic including injury and illness from road traffic collisions, air pollution, community severance, noise pollution and delays are minimised.
- We responded to the consultation on the May 2017 draft ‘UK Air Quality Plan for tackling nitrogen dioxide’, and have reviewed the July 2017 ‘UK plan for tackling roadside nitrogen dioxide concentrations’ which we refer to here as ‘The Plan’. We also submitted evidence in April 2017 to the Business, Energy and Industrial Strategy Committee inquiry “Electric vehicles: developing the market”.
Question 1. How effectively do Government policies take into account the health and environmental impacts of poor air quality?
- Government policy has contributed to poor air quality in a number of ways:
- The planning regime has resulted in residential and commercial developments which generate road traffic due to their design and location making walking, cycling or public transport unrealistic options. In particular, low density developments can result in insufficient demand to make public transport viable while also making distances to facilities too long for walking or cycling. Our blog on one particular planning application illustrates the kind of problems that have been and are continuing to be built into our towns and cities and which create additional traffic with its associate problems including air pollution
- The traditional response to congestion has been to increase road capacity, for example by adding extra road lanes. In theory, more capacity should lead to a greater throughput and less waiting, but in practice the extra capacity attracts more traffic in an effect called ‘induced demand’ thus adding to air pollution while failing to deliver the anticipated time saving benefits which were the justification for the road expenditure
- Rail electrification projects have been cancelled or delayed, surrendering or delaying the opportunity to reduce the air pollution associated with diesel trains
- Over the last 30 years in real terms the cost of motoring has fallen by 20% and the cost of public transport increased by 67%
- The government has abandoned the fuel accelerator duty increases which would have helped to make public transport more attractive relative to motoring.
- A programme of airport expansion adds to air pollution
- Most people live outside London and in these areas bus deregulation has resulted in reduced bus usage. In London bus services were not deregulated and bus usage has increased. More people driving instead of using public transport contributes to air pollution. We discuss issues with the way public transport is delivered more fully in our response to question 5.
- The Newcastle AQMAs will be 10 years old next year and air pollution in these areas is still above the legal limits (see para 13). Many children have grown up never having experienced clean air and parents who have reasonably expected that this health hazard would be fixed have been let down.
- All the above are evidence that the government policies to date have contributed to current levels of air pollution and they have not been effective at taking into account the health and environmental impacts of poor air quality.
- The 2009 Cabinet Office report “The wider costs of transport in English urban areas” identified and quantified six types of societal costs of transport: excess delays, accidents, poor air quality (particulate matter (PM) as well as NO2), physical inactivity, greenhouse gas (GHG) emissions, and noise. This report estimates each of these six types of societal cost as being of a similar order of magnitude. We have evaluated our local high street in terms of these six societal costs.
Fig 1: Comparison of the wider cost of transport in English urban areas (£ billion per annum, 2009 prices and values)
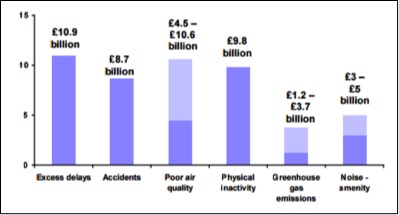
- Transport, which is predominantly based around petrol/diesel vehicles, has a wide range of impacts, of which some (greenhouse gas emissions, noise and local NOx air pollution) can be improved by switching to electric vehicles (EVs), while others (excess delays, accidents, physical inactivity and PM cannot. It is also important to note that the health effects of PM) are more significant than those of other air pollutants and PM emissions from EVs are comparable to those of petrol or diesel vehicles.
- The nature and scale of the impact of PM is described in the DEFRA report “Air Pollution: Action in a Changing Climate”:
- Chronic exposure to PM contributes to the risk of developing cardiovascular diseases and lung cancer
- Current evidence suggests that there is no “safe” limit for exposure to fine particulate matter (PM2.5)
- the gains in life expectancy that could be had from eliminating man-made fine particles (7-8 months) is larger than those possible from eliminating motor vehicle traffic accidents (1-3 months) or second-hand cigarette smoke (2-3 months).
- The focus in The Plan is on high technology, high cost solutions based primarily on the use of private road transport. In contrast, modal shift from driving to public transport and active travel (walking and cycling) are effective methods of reducing NO2 emissions while also delivering multiple other positive outcomes (such as health and economic benefits, reduction in PM, GHG emission reduction, improved local accessibility).
- The government’s recently stated intention that conventional petrol/diesel cars will be replaced by EVs or hybrids over the next 20-30 years will go some way towards reducing roadside NO2 in the medium to long term, but it will not result in any reduction in PM as EVs produce PM at equivalent or higher levels than conventional vehicles.
- From this we can conclude that government policy continues to be very poor at taking into account the health and environmental impacts of poor air quality and will result in future air pollution that could have been avoided.
Question 2. Do these plans set out effective and proportionate measures to achieve necessary emissions reductions as quickly as possible?
- No, they do not set out effective and proportionate measures to achieve necessary emissions reductions as quickly as possible.
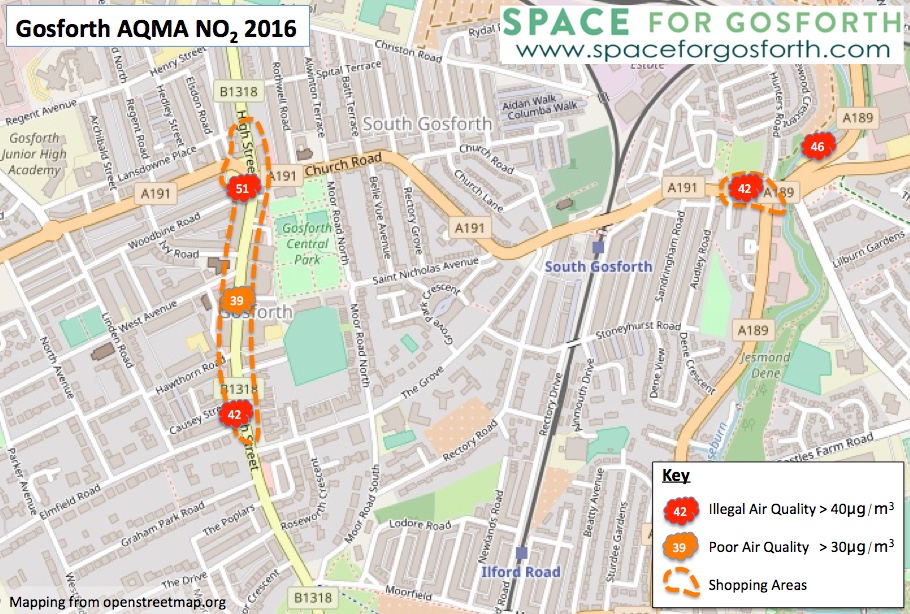
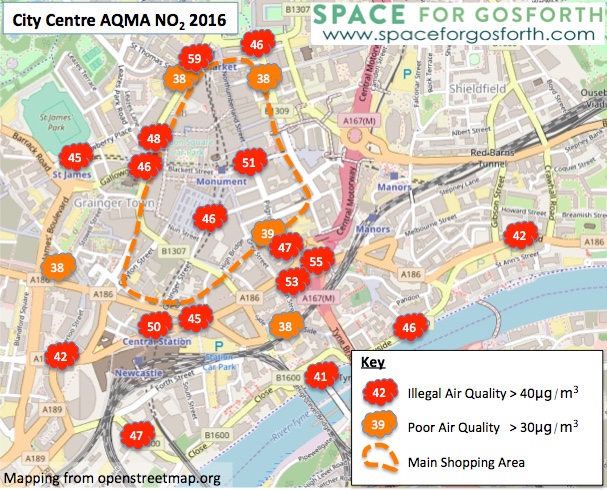
- The Plan is unrealistic about the scale of the problem. It asserts that there are only 3 roads in the Newcastle / Tyneside conurbation where action is required. However, the data from air quality monitors at locations across the city shows that that air quality breached legal limits for NO2 in 2016 in many other parts of the city including Newcastle city centre and our own suburb of Gosforth. The average 2016 NO2 levels for the Gosforth AQMA and for the city centre are shown below
- Para 116 of The Plan states “the UK government expects that implementation of Clean Air Zones will take up to three years.” Three years to implement a CAZ cannot be considered to be not achieving legal levels of NO2 ‘as quickly as possible’.
- The Plan requires local authorities to produce initial plans by the end of March 2018 and final plans by the end of December 2018. We need the ability for effective measures to be initiated well in advance of consideration of the final plan. It needs to be clear who is accountable for achieving the necessary improvement in air quality (see para 58 also)
- Para 116 of The Plan states “[the UK government] will only require local authorities to develop plans where evidence suggests measures could be put in place to bring forward achievement of statutory NO2 limit values. “ This implies that the government is prepared for a local authority to implement no local measures to reduce NO2 to legal levels, instead waiting for as many years as it takes for this to be achieved by the upgrade of the national vehicle fleet to cleaner models over time.
- Most of the measures in The Plan will be effective in the medium to long term rather than the short term and many are not ready for implementation now as they require further work before implementation can start.
- The Plan refers to ‘encouraging the use of public transport, walking and cycling’. It is not enough to simply promote these travel options. Without action to make them more attractive, seeking to achieve modal shift is simply relying on behaviour change without changing the framework within which people make decisions about how to make their journeys. It will not be effective since it relies on expecting people to make changes and/or to choose higher personal cost or inconvenience now in return for wider public benefits in the future (bear in mind that while the cost of public transport increased by 67% the cost of motoring fell by 20%).
- The cost and non-cost barriers to these travel choices need to be understood and addressed as a public policy priority so that the balance of cost, convenience, ease and comfort between private car travel and other options needs can be rebalanced so that public transport or active travel are more attractive options for more people for more of their journeys. This will require significant increase in investment in active travel infrastructure and in public transport, plus a far reaching review of how public transport is planned, operated and paid for, and the powers that local government have to improve public transport so it can be planned to meet local needs for mobility, for improved air quality and to play its part in achieving wider environmental benefits i.e. GHG reduction. We discuss issues related to active travel infrastructure further in our response to question 3, and issues around the framework around public in our response to question 5.
- There is a strong presumption in The Plan against the measure that the government has identified as most effective at reducing emissions as quickly as possible i.e. charging CAZs, and also against reducing the availability of parking and/or increasing parking charges which are measures that could be introduced very quickly and which could strongly influence people’s travel choices.
- There is no mention of closing roads or restricting access to reduce air pollution in specific areas even though this is a very effective way of reducing pollution. Over the last year we have been able to see the impact that reducing traffic levels has, even if only for a short period.
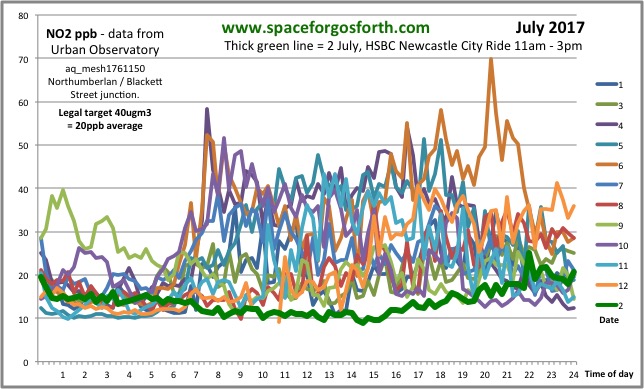
- On 2 July 2017 parts of Newcastle city centre were closed for a cycling event. Part of the route for the day passed an air quality monitor in the city centre. The graph below shows that levels of NO2 on 2 July (the dark green line) were much lower than any other day in July and also therefore how legal compliance can be achieved almost instantly by reducing traffic levels.
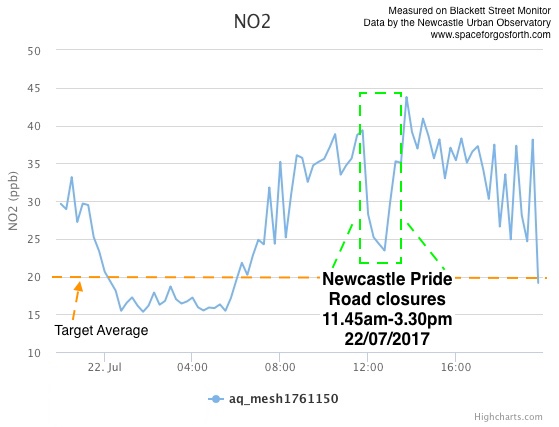
- Later in July there was a further brief road closure for the Northern Pride march. Even though this lasted only a few hours caused, levels of NO2 reduced significantly in that short period.
- Further, there is no indication that the Clean Air Fund will provide sufficient funds to enable each affected local authority to achieve compliance as quickly as possible. The process is referred to as ‘bidding’ rather than ‘applying’ which suggests that this is a competitive process and that not all applying local authorities will receive the funds they need. At the same time the government is strongly discouraging LAs from implementing measures (charging CAZs or increases to parking charges) that might raise funds that could be used to improve air local quality.
Question 3. Are other nations or cities taking more effective action that the UK can learn from?
- Other cities have taken actions which will reduce air pollution such as
- car free days (eg Bogota, Paris)
- banning cars from the city on high pollution days (eg Paris, Milan)
- banning older cars from the city (eg Paris)
- extensive pedestrianisation (eg Paris)
- alternating bans of cars based on number plates on high pollution days (eg Rome, Athens, Mexico City)
- special “anti-smog” all-day public transport ticket (€1.50 in Milan)
- Berlin has implemented a low emission zone that bans all diesel vehicles and petrol vehicles that failed to meet emission standards. The zone covers 88 sq. km of the inner city and approximately one-third of Berlin’s inhabitants.
- Bogota has implemented a bus rapid transit system which moves high volumes of people at speed by through an extensive network of dedicated bus lanes.
- USA has fined Volkswagen $ billions for emissions cheating. A similar action here would provide funding that could be used to fund the implementation of measures to improve air quality measures.
- The rest of our response to this question refers to the potential for active travel to reduce air pollution (PM as well as NO2) as well as reducing GHG emissions, reducing congestion and improving public health through increased activity as well as through improved air quality. We describe the barriers that exist that prevent people from walking or cycling, and how other countries have addressed these more successfully than the UK and from which we can learn.
Barriers to active travel
- The safety related barriers to people walking include are no safe places to cross roads, roads that can only be crossed in several stages, underpasses than feel unsafe, or bridges that are difficult of inaccessible for people with limited mobility or with children’s pushchairs. Other barriers arise from planning decisions that result in low density housing where there are not facilities such as shops, schools and public transport connections within walking distance.
- The barriers to people cycling are well evidenced by the national British Social Attitudes Survey 2013 which identified a significant potential to increase the number of journeys being cycled instead of driven, but that the fear of traffic is a major barrier to people taking up cycling:
- When asked about the journeys of less than two miles that they now travelled by car
- 33% said that they could just as easily catch the bus
- 37% said they could just as easily cycle (if they had a bike)
- 40% of people agreed that they could just as easily walk.
- 61% of all respondents felt it is too dangerous for them to cycle on the roads, rising to 69% for women and 76% for those aged 65 and over.
- Research in our home city of Newcastle upon Tyne in 2015 tells a similar story: 54% of people in the city said they could begin to ride a bike or ride their bike more often. When non-cyclists were asked about what kind of bike routes would help them to start cycling, 90% said traffic-free routes and 85% said bike lanes protected by a kerb.
- This evidence shows that the lack of quality of cycling infrastructure, in particular routes that are convenient and feel safe for cycling, is a key barrier to people taking up cycling.
- Other cities and countries have been much more effective at achieving high rates of cycling including other climatically similar northern European countries for example Denmark (19% of trips are cycled) and the Netherlands (27%). They have achieved this by taking action to overcome the barriers to cycling by
- higher levels of investment in cycle infrastructure and continued year on year over the long term
- quality cycle infrastructure
- more recently, grants to encourage uptake of electric bikes.
- Seville is a great example of what can be done very quickly and gives a benchmark for ‘the shortest possible timescales’ as required by the court. Seville built enough connected, safe lanes to lead to the number of bike trips multiplying 11-fold in a just few years. Calgary has rapidly implemented a complete city wide cycle network.
- The Swedish Parliament adopted a “Vision Zero” road safety policy in 1997. This sets a target of zero deaths and zero serious injuries in the road traffic environment and puts the responsibility for achieving this goal on all those responsible for the total road safety system. This means that the detailed design of the road, the vehicle and driving behaviour must be tackled as a “total system” so that “a mistake in the road traffic environment does not carry the death penalty”. Sweden is the best performer in the EU 28 on traditional measures of road safety. Adopting Vision Zero in the UK would create a safer environment for the most vulnerable road users (i.e. people walking and cycling), and would enable more people to walk or cyclemore often, with associated air pollution benefits.
- Most other European countries have the ‘presumed liability’ system. Presumed liability for road traffic collisions would mean that following a collision between a motorist and a cyclist or pedestrian, the motorist (in practice, their insurer) would be presumed liable for injury, damages or loss, unless they can demonstrate otherwise. The same would apply in cases where cyclists collide with pedestrians. It is fairer than the current fault-based system as it shifts the burden of proof from the vulnerable to the powerful. This is particularly important because as Lord Danesfort observed in 1934 pedestrians and cyclists are often unable to obtain compensation because “they very seldom can get adequate evidence. If a pedal cyclist is killed he is not there to give evidence; if he is seriously injured it is quite impossible for him to give complete or satisfactory evidence of the circumstances in which he was injured.” [In 1934 Lord Danesfort introduced the Road Traffic (Compensation for Accidents) Bill 1934 which proposed that cyclists or pedestrians killed or injured as a result of a road collision with a vehicle should automatically be able to recover compensation without the need to prove the driver was at fault.]
- Changes to the law to improve the legal position of vulnerable road users with a strict or presumed liability system could be achieved relatively quickly with legislation which would put the UK in line with its European counterparts. Such changes would be unpopular with motor insurers and many motorists, but in all probability would substantially increase cycle awareness on the part of all road users and ought to reduce the number of casualties on our roads.
Investment in infrastructure for active travel
- Denmark and the Netherlands have expenditure on cycle infrastructure equivalent to £24/person per year.
- In comparison, the government’s Cycling and Walking Investment Strategy will invest £1.2bn over the 5 years from 2016 to 2021, which equates to £3.69 per person per year for cycling and walking combined. However, there is widespread public support for a significant increase in public expenditure on cycling infrastructure to levels that match those in the Netherlands and Denmark: a survey showed that 75% support more investment in cycling, with £26/person per year the average amount people want governments to be investing.
- The Department for Transport’s assessment of a sample of cycle schemes found a benefit cost ratio (BCR) of 5.5:1 i.e. for every £1 of public money spent, the schemes provide £5.50 worth of benefit and “deliver very high value for money”. In comparison, the BCR for the £56 billion HS2 is between 1.4:1 and 2.5:1. We are therefore confident that investment in quality cycling infrastructure will be a very good investment of public money.
Quality infrastructure for active travel
- Adopting a Vision Zero approach to road safety throughout the UK [see also here for a view from Sustrans], backed up with the necessary level of funding, would create road systems that enable people to feel safe walking and cycling.
- As well as providing more cycle infrastructure through higher levels of investment than the UK, the Netherlands provides much better cycle infrastructure through better design than in the UK where there are too many examples of cycle infrastructure that is not safe, comfortable and direct enough to attract new people to cycling instead of driving. We recommend adoption of best practice in design and construction of cycling infrastructure, for example as documented in the London Cycling Design Standards 2014. This documents six core outcomes which ‘together describe what good design for cycling should achieve: Safety, Directness, Comfort, Coherence, Attractiveness and Adaptability. These are based on international best practice and on an emerging consensus in London about aspects of that practice that we should adopt in the UK.
Grants for electric-bikes
- The potential of e-bikes to achieve multiple policy objectives, from greenhouse gas emissions to public health, has not yet been fully recognised. The batteries are rechargeable via a normal power socket and, unlike EVs, do not require any special or costly charging infrastructure. The battery can be used to boost the rider’s own pedal power as and when the rider requires which means that, compared to conventional bikes, e-bikes enable more people to cycle more distance and over hillier terrain more easily and to carry more weight, such as children or shopping. The boost effect means that people who are currently inactive or with existing health conditions can start to cycle with confidence, and that people who do cycle can carry on cycling with confidence despite any decline in health or fitness later in life. One of the barriers to update of e-bikes is the higher cost compared to a standard bike.
- It is common to provide subsidy for new technologies (such as photo-voltaic cells or EVs) to increase uptake while scale and technological advances reduce unit costs. An e-bike subsidy would assist in increasing the number of journeys cycled and recognise the benefits to the wider community in terms of reduced air pollution, reduced congestion and reduced GHGemissions.
- France provides a 20% subsidy for e-bikes up to a maximum of 200Euro. Oslo provides subsidy of 1,200Euro for electric cargo bikes.
- In contrast the e-bikes were excluded from the UK governments plug in grant scheme that subsidised EVs up to £4,500 for cars, up to £8,000 for vans and up to £1,500 for motorbikes.
Question 4. Is there enough cross-government collaboration to set in place the right fiscal and policy incentives?
- Transport schemes in the UK are appraised using the WebTAG online guidance which set out the methods to be used by local authorities to assess their financial viability. The Treasury Green Book recommends using Benefit-Cost Ratios (BCRs) for appraisal of investments, which are designed to include weighted social and environmental costs or benefits. Transport planners are ‘encouraged’ to place monetary values on the social and environmental impacts of transport policies, but this is rarely overseen by the DfT. As such, the government must update its guidance on transport appraisal to increase the importance of these impacts, in particular the impact of transport investments on air quality and the health of communities.
- The updated guidance issued in March 2017 suggested that new estimates of the damage costs of air pollution are included in the appraisal of transport schemes, yet local authorities still seem to place higher importance on the economic aspects of transport investment than the environmental and social impacts and damage. The government must update its guidance to give firm indications to local authorities on the inclusion of air pollution impacts in appraisal of transport schemes. Air quality impacts should also be calculated for user of vehicles themselves and offset against any benefits, given recent studies showing that the highest impacts are felt by car drivers. Calculation of the NPV of any air quality change resulting from a transport investment must be based on latest and realistic emissions factors (in light of recent scandals surrounding Volkswagen), latest evidence on health impacts, and be given equal or higher weight to things like value of time savings in the WebTAG summary table.
- Transport practitioners are increasingly calling for a wider update to the way that transport schemes are appraised in the UK. The government must embrace these questions, such as the suitability of their models (as being studied by the Commission on Travel Demand), the use of time savings to justify schemes and their conversion to economic benefits, and the importance of quality of life and other social outcomes in transport investment decisions.
- These points all point to a need for new thinking in how transport policy incentivises investment in schemes and how there are given central government finance. Investment in roads often has leads merely to increased demand for more investment in roads, further worsening environmental impacts such as air pollution. There is little evidence that investment in road schemes to relieve congestion actually has that effect, and thus air pollution benefits are rarely realised. Research published by Duranton and Turner showed that vehicle miles travelled increases proportionally with road investment, and thus that increased provision of roads is unlikely to relieve congestion. Instead, investment in road schemes to alleviate congestion and air pollution will instead have the effect of making that pollution worse.
- Given the evidence that traditional transport investment policy is unlikely to lead to the right decisions on air pollution reduction, new thinking is needed from central government. Investment in walking and cycling, fiscal incentives to reduce car travel (such as congestion charging, higher parking costs, a return of the Fuel Duty Escalator), and tighter links between transport and land-use policy to improve the viability of active travel are vitally needed.
- Joined up thinking across government departments will enable DCLG’s planning strategy and the DfT’s transport strategy to deliver the environmental and health outcomes sought by DEFRA and DoH and to reduce the financial burden on the NHS of ill health.
Question 5. How can those charged with delivering national plans at local level be best supported and challenged?
- A better public understanding of the effects of air pollution, the local levels of air pollution and actions that are being undertaken by national and local government to reduce it are critical to enabling citizens to be part of the solution and/or to be able to challenge government, through the courts if necessary. This requires:
- A comprehensive national public engagement strategy that proactively raises awareness of the air pollution problem and the actions being carried out to tackle it. Widespread and accurate monitoring of air pollution – it is not enough to rely on modelling extrapolated from a small number of monitoring stations.
- Currently the way that government and local authority websites provide air pollution data are not user-friendly for the general public, lack information and are often out of date. The government should facilitate a national system that ensures transparency and allows local communities to directly access relevant and up to date information at a national and local level. The information provided needs to show chronic air pollution (eg rolling annual averages) as well as specific peaks as both are harmful.
- The government should be ambitious in how this information is made available and follow the example of China where the government has built a nationwide network of monitors tracking levels of PM2.5 and has made the data from those monitors publicly available. It has done the same with measurements taken outside thousands of factories. Anyone with a smartphone in China can now check local air quality in real time, see whether a particular facility is breaching emissions limits, and report violators to local enforcement agencies via social media. A similar approach could be taken here for NO2 (the subject of this inquiry) and for PM.
- The UK government should also ensure that the general public is proactively alerted about high pollution events when they are forecasted and as they happen using a range of channels including on street signage, local radio and TV, and the internet. This will help people protect their health and consider how they can reduce their contribution to the problem. The current system is based on thresholds that are too high and don’t cover all pollutants. It is also a passive system that relies on individuals looking for the information on line. An air pollution alert system could use the similar systems in place for heat waves and cold weather warnings
- As well as setting the framework for local action and monitoring progress, the government should help local authorities to develop, implement, monitor and adjust their plans by facilitating sharing experience of what works well and what doesn’t, accompanied by the latest evidence on the health effects of the different air pollutants and their sources. This should cover each of the pollutants that will be the subject of the government’s 2018 Wider Clean Air Strategy.
- Local government could be supported to deliver improvements in air quality by increasing active travel i.e. walking and cycling by making higher levels of funding available for cycling and walking infrastructure and by helping them to deliver higher quality infrastructure through the use of standards and sharing of best practice (see our response to question 3 for more information).
- Local government could be supported to deliver improvements in air quality by having greater powers over public transport and by wider area action on planning and public transport:
- The Plan does not fully acknowledge or address factors limiting a local authority’s capacity to deliver improved air quality and issues of equity. Although Newcastle is the business driver for the North East in many ways, it’s also a poor city. As a regional centre, it has air quality problems imposed on it by residents and businesses in other local authorities and by poor public transport, but the air quality health burden falls on Newcastle residents.
- Traffic from outside the city is a key factor in its pollution, but people may not have an alternative, or if they do have one, they are not incentivised to use it. For example, there is a lack of commuter rail routes into the city, but that isn’t an issue that the Council has any control over. These residents of neighbouring authorities don’t have the pollution where they live nor will they face any penalties if Newcastle City Council is fined for breaching air quality. Local authorities need to have some comeback when their neighbouring authorities behave irresponsibly, and wider area action on planning and public transport is needed to ensure that actions of other local authorities don’t create air quality problems for Newcastle residents. The suggestion in The Plan that local authorities should be “working with…..neighbouring authorities to ensure a consistent approach” is inadequate to address these challenges.
- The Plan says that “local authorities have the means to work collaboratively with bus operators to think about how best to improve the local network to make it more attractive to passengers and raise the environmental standards of the buses used“. Local authorities such as NCC do not have the powers to make the changes that would make public transport a more attractive option: it has no powers over routes or timetabling or fares or integrated ticketing. Indeed, the bus operators in Newcastle have resisted proposals for integrated ticketing. Without providing local authorities such as Newcastle with the necessary powers, an exhortation to work collaboratively with the bus operators will be limited in its effectiveness.
- In addition, powers must be granted for local authorities to specify the standard of buses to ensure that buses operating through AQMAs are of the highest possible emissions standards. In Newcastle, bus operators are still using Euro 2 and Euro 3 vehicles in the city’s two AQMAs and the LA are powerless to prevent this.
- A far reaching review is needed of how public transport is planned, operated and paid for, and the powers that local government have to improve public transport so it can be planned to meet local needs for mobility, for improved air quality and to play its part in achieving wider environmental benefits such as GHG reduction.
- At present there are multiple barriers to public transport in our region of Newcastle upon Tyne and surrounding areas: fragmentation, uncoordinated routes, cost, complexity, and no single ticketing scheme. It will therefore take more than warm words of encouragement to achieve a modal shift towards public transport. We need an overhaul of the approach to how public transport is organized and funded. The deregulation of buses outside London has not delivered an attractive cost effective alternative to private transport. This needs to be addressed as a matter of urgency. The Buses Bill does not go far enough in this respect and makes it difficult for local authorities to make use of franchising. Both a re-think of central government funding for public transport and an overhaul of the transport appraisal methodology is needed to ensure the social and environmental benefits of public transport are weighted highly when assessing any scheme. Additional benefits from improving the public transport service are increased mobility and access to employment and educational opportunities for disadvantaged groups- young people who can’t afford a car. It is important to note that approximately half of households in Newcastle upon Tyne do not have a car.
- A clear governance framework is needed to set out clearly who is accountable for ensuring air quality targets are met for a given location (and who would be sued for failure), when those targets should be met, how they should be measured, and a set of mandatory emergency measures that must be applied if targets are not met in the mandated timescales.
