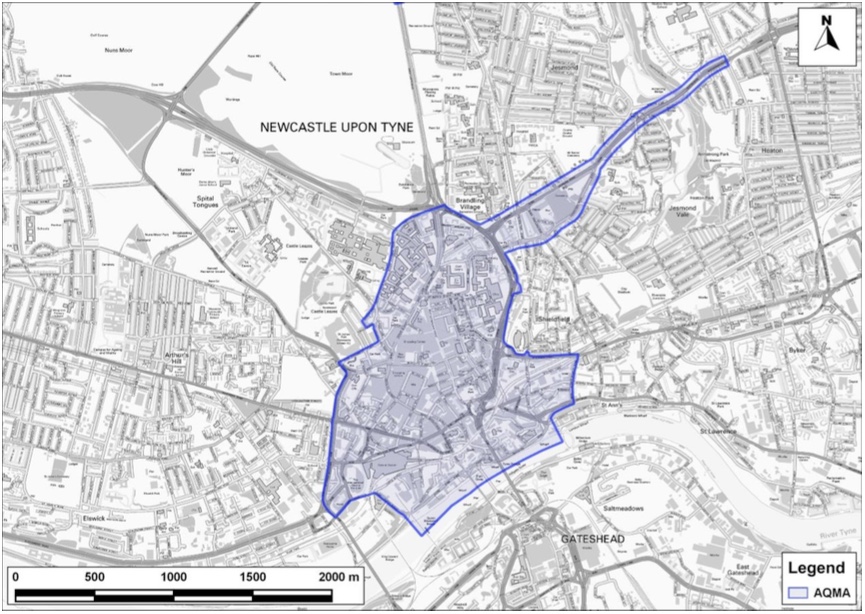
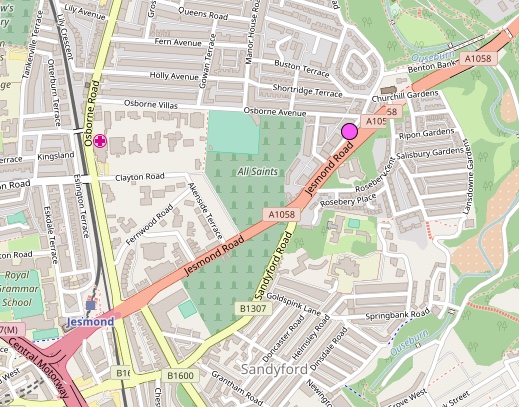
In our last post Black Friday, Smoggy Saturday… we shared some data from the monitor in Salters Road car park. In this post we look at the City Centre Air Quality Management Area (AQMA), including equivalent figures from the air quality monitor sited at Jesmond Road, 150m west of the Osborne Avenue traffic lights, to see how this compares to Salters Road and whether the recent increase in air pollution is replicated there.
The current City Centre AQMA was declared on 1 April 2008, with the deadline for compliance with European air quality limits being 1 January 2010. In 2015, Newcastle was one of 169 Local Authorities including North Tyneside Council and Gateshead Metropolitan Borough Council where the annual mean nitrogen dioxide (NO2) air pollution limit was still being exceeded.
In November 2016, the High Court ordered the Government to produce a new draft plan to meet air quality targets by 24 April 2017 and a final plan by 31 July 2017. This was after an earlier government plan to tackle air pollution was declared illegal in April 2015 and a further plan produced in December 2015 was also found not to meet the law’s requirement of cutting NO2 pollution to legal levels in the “shortest possible time”.
Results from Jesmond Road
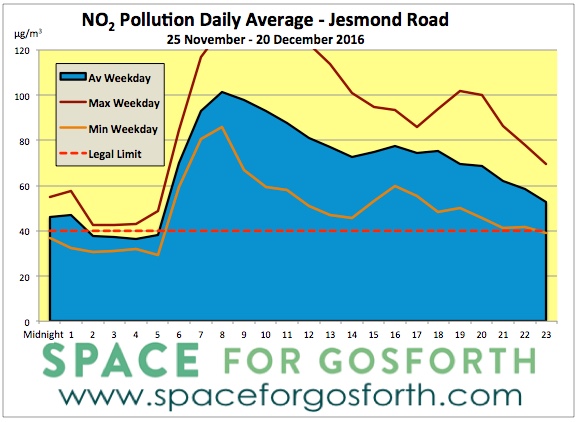
Since Black Friday, 25 November 2016, readings from the Jesmond Road monitor show an average level of NO2 of 67.1 micrograms per cubic metre (μg/m3) or 68% above the annual legal limit, compared to 50.3 μg/m3 at the Salters Road junction. The peak figure recorded was 193.3 μg/m3 on 28/11 at 19:15.
TADU (Traffic & Accident Data Unit) monitoring data shows that during 2015, the average number of vehicles passing this point every weekday was 50,280.
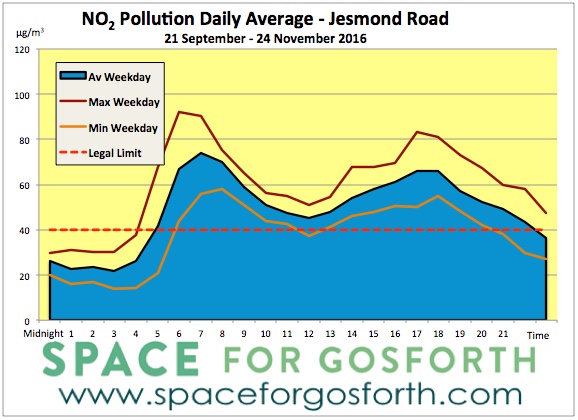
In common with Gosforth, the average readings for the two months prior to Black Friday are much lower although in this case, at 46.6 μg/m3, still above the annual legal limit of 40 μg/m3. This suggests the recent (possibly temporary) increase in pollution at these sites is unrelated to any specific changes to road layouts and most likely has some other underlying cause.
City Centre Monitoring 2015
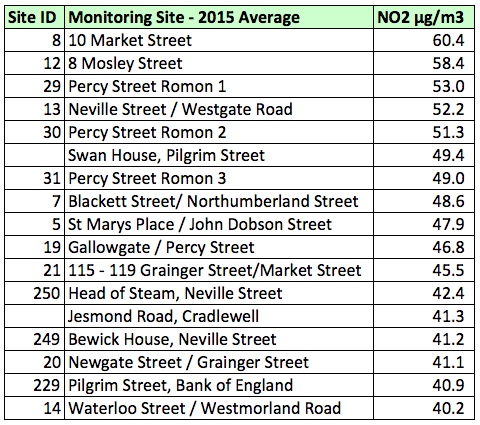
For the rest of the City Centre AQMA we have to rely on results from the NO2 diffusion tube monitors from the 2016 Air Quality Status Report. This shows that in 2015 the legal maximum was exceeded at the 17 monitoring sites listed below.
Of these sites 7 showed an increase compared to 2014 including Jesmond Road and Market Street, and 7 showed a decrease in pollution levels. Three of the measuring sites were new for 2015.
Clearly, Newcastle City Council needs to take urgent action in order to bring pollution levels to within legal limits and to protect the health of those that live, work, shop or study in Newcastle city centre and nearby areas.
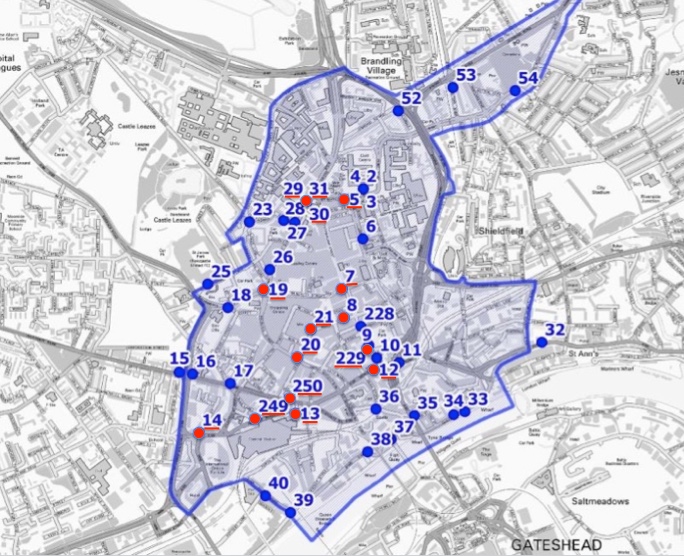
City Centre Air Quality monitor locations

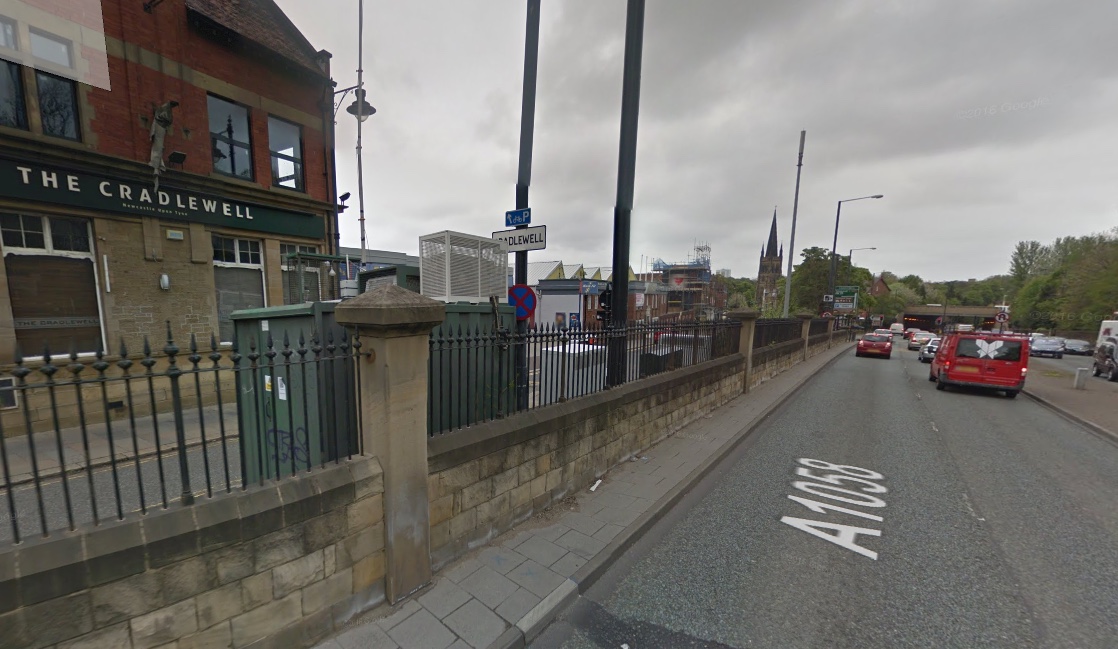
Slowing down for 20mph limits /traffic lights causes more pollution in the city (as does and the slowing down for lights and speed cameras on Jesmond road going East ( see photo) )
Cowgate roundabout has more pollution than before according to a letter in The Journal 3/1/17 .Cowgate now has 30 mph before it gong West on CME and traffic lights .so more cars idle at non peak times that previously . Osbourne road probably also has more pollution since the introduction of 20mph . As ,no doubt ,will areas in City Centre than force cars into single line due to bus lanes .( see monitors 5 and 31 on map) The roads leading to Central station will also have more pollution due to single file traffic from High Level bridge to past Central station ( see 12,13,14,249and 250 monitors on the map)
Hi Ken, thank for the comment. Speed is definitely a consideration on the open road but research we’ve seen on city driving, where stopping at junctions to allow other traffic or pedestrians to cross is unavoidable, suggest that limiting speeds to 20mph actually reduces pollution as well as making roads safer.
20’s Plenty have done a summary here: http://www.20splentyforus.org.uk/BriefingSheets/pollutionbriefing.pdf
Just to pick a few highlights:
– ‘Along shorter roads with junctions and roundabouts, limiting acceleration to up to 20 mph reduces fuel consumption’
– “It is unlikely that imposing strict speed limits in urban areas has a significant influence on emissions of NOx or CO2.”
20’a plenty also highlight that the presence of speeding vehicles, and no doubt a lack of crossing facilities, deter people from walking or cycling, and if that means they drive instead then that adds to pollution. Likewise if buses were to be stuck in traffic rather than having their own lane then more people would chose to drive instead and again that would add to pollution.
The fairly recent addition of motorbike Deliveroos to Osborne Road can’t be helping…why aren’t they all on pushbikes? Apart from the pollution, yet more noise is adding to the hell of Osborne Road.
Quote:
“In common with Gosforth, the average readings for the two months prior to Black Friday are much lower although in this case, at 46.6 μg/m3, still above the annual legal limit of 40 μg/m3. This suggests the recent (possibly temporary) increase in pollution at these sites is unrelated to any specific changes to road layouts and most likely has some other underlying cause.”
Proposed contributing factor – ambient air temperature. Diesel engines put out more Nitrogen Oxides (NOX) when it is cold, and the weather itself may aid in concentration.
Sources:
https://www.sciencedaily.com/releases/2011/02/110222083153.htm
“Diesels more polluting below 18C, research suggests”
http://www.bbc.co.uk/news/business-36589106
Thanks Ed. Yes cold weather can make pollution worse, especially for short journeys where cars don’t have time to warm up. I doubt it will explain the difference though given there was only about 2C difference between the two periods and the Met Office are reporting that December in the NE was 2.2C warmer than the long term average. Possibly this means the pollution recorded is less than we should expect for an average year?
Met Office: http://www.metoffice.gov.uk/news/releases/2016/2016-a-year-in-weather-statistics
Thanks for the Science Daily link too. Some of the related articles looked quite interesting:
Air Pollution Affects Young People’s Psychiatric Health
https://www.sciencedaily.com/releases/2016/06/160608100542.htm
Variable Congestion Charges May Yield More Stable Air Quality and Improved Health https://www.sciencedaily.com/releases/2012/12/121214091022.htm
There is no reasonable excuse that public transportation (buses) is not via electric energy. Someone has to make a start, and the city council could start with buses. Of course, if our excuse is always “This is cheaper” then we end up like in India’s capitol, where all children suffer from asthma and everyone will dye from cardiovascular disease at an early age. Even China has realised that this is a problem and they will enforce electric cars sooner than any other country over the next coming years.
On a separate note – most cars I see have one person in the car, rarely 2 or more….