
This is our sixth annual pollution blog covering official air quality monitoring in Newcastle upon Tyne. In all six years, air pollution in Newcastle has exceeded legal limits.
The main pollutant of concern in Newcastle is Nitrogen Dioxide (NO2). The legal maximum for NO2 is 40μg/m3 averaged over a calendar year. In 2021, the highest reading was 98μg/m3, over double the limit. The World Health Organisation (WHO) recommend NO2 should be no more than 10μg/m3 averaged over a year.
2021 Highlights:
- Overall, pollution was less than 2016-2019, but still didn’t meet UK legal limits.
- St James’ Park, home of Newcastle United Football Club, was the most polluted location in the city centre.
- The worst pollution recorded across Newcastle was 98μg/m3 on The Coast Road by the junction with Jesmond Park West.
- Measurements from Gosforth and The West End were all within UK legal limits for the second year running, though still substantially over the WHO’s recommendation.
- The Clean Air Zone, originally planned for January 2020, has still not been implemented.
- Traffic levels remain lower than pre-Covid in many areas though back to pre-Covid levels on some of the main commuter routes.
Newcastle City Centre
In the city centre, Strawberry Place next to St James’ Park was the most polluted with a Nitrogen Dioxide (NO2) reading of 54.1μg/m3, substantially above both the 40μg/m3 legal maximum for the UK and the WHO recommendation.
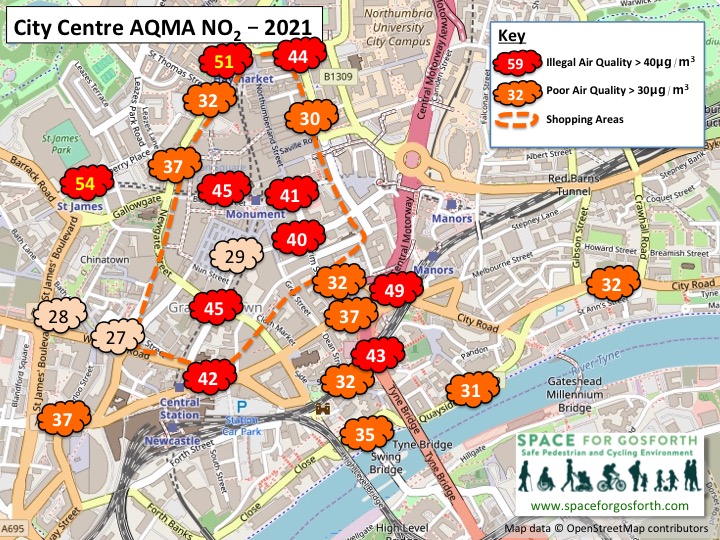
City Centre Air Quality Management Area (AQMA)
These are the city centre locations where air pollution exceeded the legal limit in 2021
- 54.1μg/m3, DT25 (Strawberry Place between St James Park and Nine Bar)
- 50.8μg/m3, DT29/DT30/DT31 (triplicate co-location site, Percy Street)
- 48.7μg/m3, DT12 (8 Mosley Street)
- 45.4μg/m3, DT20 (Newgate Street/Grainger Street)
- 45.4μg/m3, DT65 (Blackett Street, Old Eldon Square)
- 44.2μg/m3, DT5 (St. Mary’s Place/John Dobson Street)
- 42.1μg/m3, DT13 (Neville Street/Westgate Road)
- 41.2μg/m3, DT7 (Blackett Street/Northumberland Street)
In 2019 (pre-Covid), Blackett Street was the most polluted location in the city centre with a measurement of 71μg/m3. Also higher in 2019 were Central Station (69μg/m3), Haymarket (66μg/m3) and Grainger Street (65μg/m3).
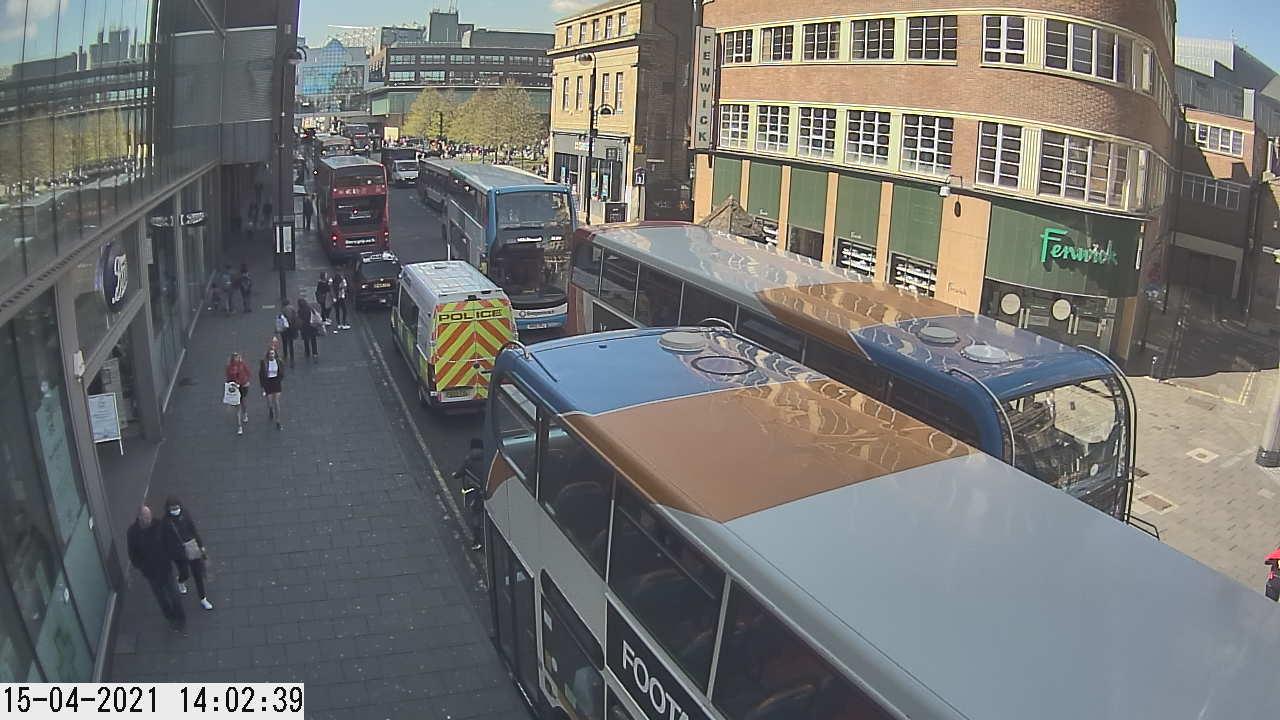
Air pollution on Blackett Street in 2021, including from buses, was measured at 45μg/m3.
Reduced levels of pollution in the city centre could be due less traffic, possibly also due to bus companies investing in cleaner vehicles ahead of the Clean Air Zone. For examples, Go North East launched two all-electric bus routes in November 2020, with support from the Government’s Ultra-Low Emission Bus Fund.
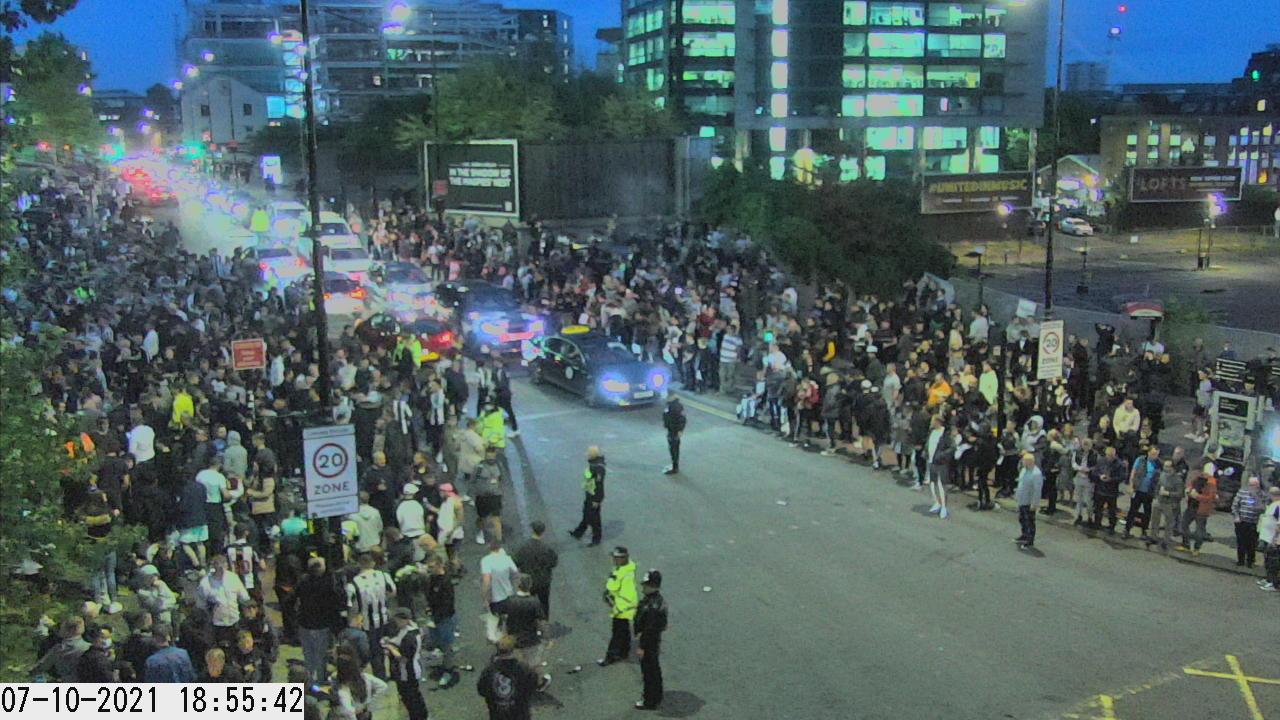
Crowds and cars on Strawberry Place on the day of the NUFC takeover announcement.
One big question is why through-traffic is still allowed through the city centre adding to the pollution, when the Council’s Urban Core Plan (adopted in 2015) said “Policies will direct traffic which does not need to travel into the Urban Core onto major routes around the edge of the Urban Core.” Google Maps, for example, still shows the quickest driving routes from Redheugh Bridge to Blue House roundabout are directly through the city centre via Percy Street or via Newcastle Central Station.
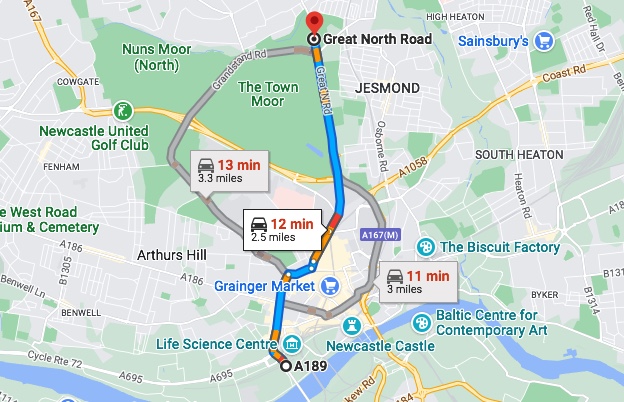
Google Maps showing driving routes from Redheugh Bridge to Blue House roundabout.
PM2.5, very small particulate matter pollution, is also measured in the city centre at the Civic Centre. In 2021 the reading was 7.1μg/m3, which is less than the UK Legal limit 20μg/m3, but higher than WHO guidance that the annual average should be no more than 5μg/m3.
Plans for a cycle lane on Percy Street, long one of the most polluted streets in the city, were shelved in 2019 because the space would be needed by buses re-routed from Blackett Street. Now the Blackett Street plans have been put off is it time to look again at Percy Street?
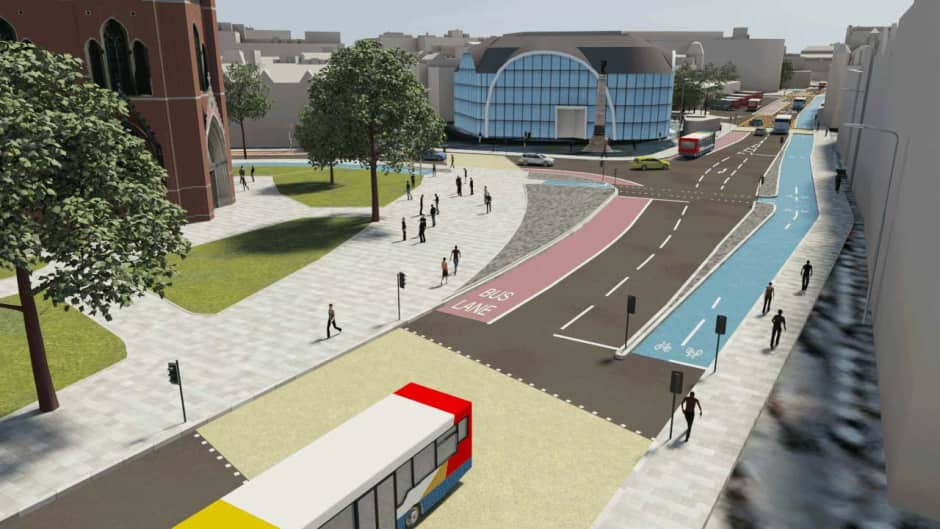
Plans for a cycle lane on Percy street were shelved in 2019.
Central Motorway and Coast Road
The Council’s pollution plan analysis from 2019 was that air quality on The Coast Road would be compliant in 2021 and that no additional measures would be required. Clearly that hasn’t worked out as two locations were still above legal limits, one substantially so (almost 2.5 times the limits).
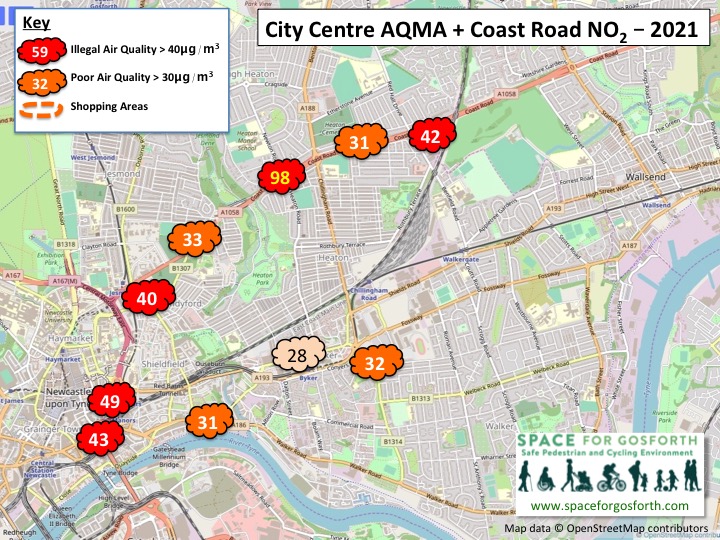
These are the central motorway and coast road locations where air pollution exceeded the legal limit in 2021
- 97.7μg/m3, DT81 (Stephenson Road, entrance to Jesmond Park West)
- 43.4μg/m3, DT80 (A167 AQ Mesh)
- 42.9μg/m3, DT79 (Tyne Bridge)
- 42.4μg/m3, DT84 (A1058 Coast Road, Wills Building)
Drivers and car passengers who use this route every day will be exposing themselves to significant levels of pollution, especially as pollution levels within vehicles are typically much higher than the air outside.
The Coast Road (46,000 vehicles a day in 2021) and Tyne Bridge (53,000 vehicles) are two of the busiest vehicle routes in the city. Achieving pollution limits without cutting vehicle volumes is going to prove very hard at these locations. For comparison, Gosforth High Street had 15,200 vehicles a day on average in 2021.
A1058 Corner House/ Stephenson Road, westbound, the earlier broken down white Audi A3 that was obstructing the exit for Heaton Road has now moved on.#Newcastle pic.twitter.com/2M1s0pwxj1
— North East Live Traffic (@NELiveTraffic) November 3, 2022
We often hear people saying we should add extra lanes or remove traffic lights to “let the traffic flow” but all that ever means is bigger queues and more pollution at the next junction, as it is not possible to completely eliminate junctions in a city.
Many cities across the world are now considering removing urban motorways including Glasgow where there is a campaign to replace the M8.
A167(M) Central Motorway, southbound delays and traffic building up under the Swan House roundabout with tail backs forming.#Newcastle pic.twitter.com/DsSOtXGZCl
— North East Live Traffic (@NELiveTraffic) November 2, 2022
Gosforth
In 2021, all Gosforth High Street monitors recorded pollution levels within legal limits, thoroughly debunking irresponsible scaremongering claims of “significantly more toxic fumes” due to the High Street Covid scheme. These were the second lowest readings since the Salters Road junction was remodelled in 2016.
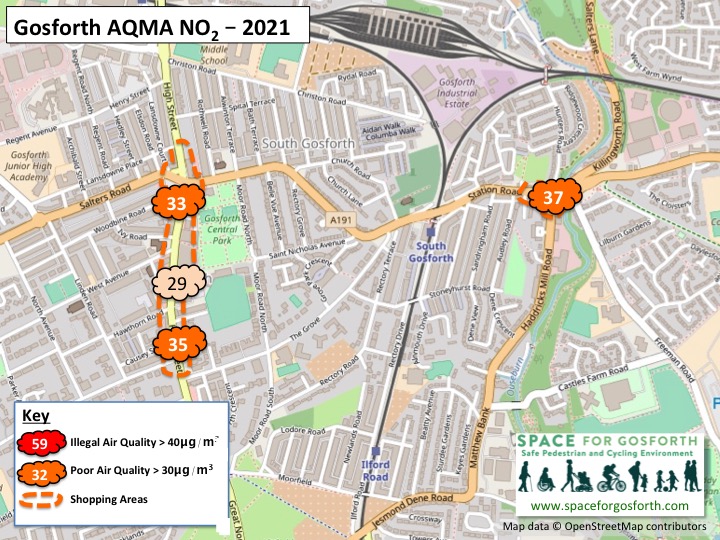
Gosforth Air Quality Management Area (AQMA)
The four pollution measurements shown in Gosforth (all within UK legal limits) are:
- 37.4μg/m3, DT50 (84 Station Road)
- 34.6μg/m3, DT43 (53 High Street, Gosforth)
- 28.7μg/m3, DT44 (102 – 104 High Street, Gosforth)
- 32.9μg/m3, DT45 (201 Gosforth High St)
We noted in our We still love Gosforth High Street blog that if air pollution measurements in 2021 were less than the legal limit, the Council would be bound by the Air Quality Standards Regulations 2010 to “ensure that [pollution] levels are maintained below those limit values” in future.
The main reason for the lower pollution levels is likely to be because there was less traffic on Gosforth High Street in 2021. The new layout may have contributed to this.
The graph below shows that air pollution at the three High Street monitoring sites and average daily traffic measured just north of The Grove are clearly linked. Because of this, doing anything that increases vehicle capacity on Gosforth High Street would potentially be in violation of the Air Quality Regulations.
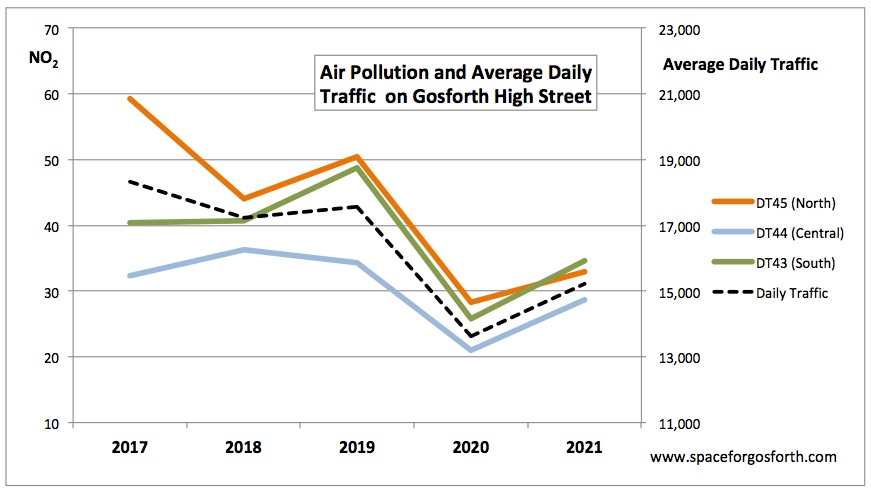
Air pollution and average daily traffic on Gosforth High Street
Average daily traffic in 2022, up to the end of September, is still less than 16,000 vehicles a day so pollution in 2022 is likely to be slightly higher but still be under the limit.
Whatever the actual cause of the reduction in air pollution, it is clear that less traffic means less pollution.
The Council have also confirmed the Covid road layout hasn’t had any significant impact on journey times for people driving.
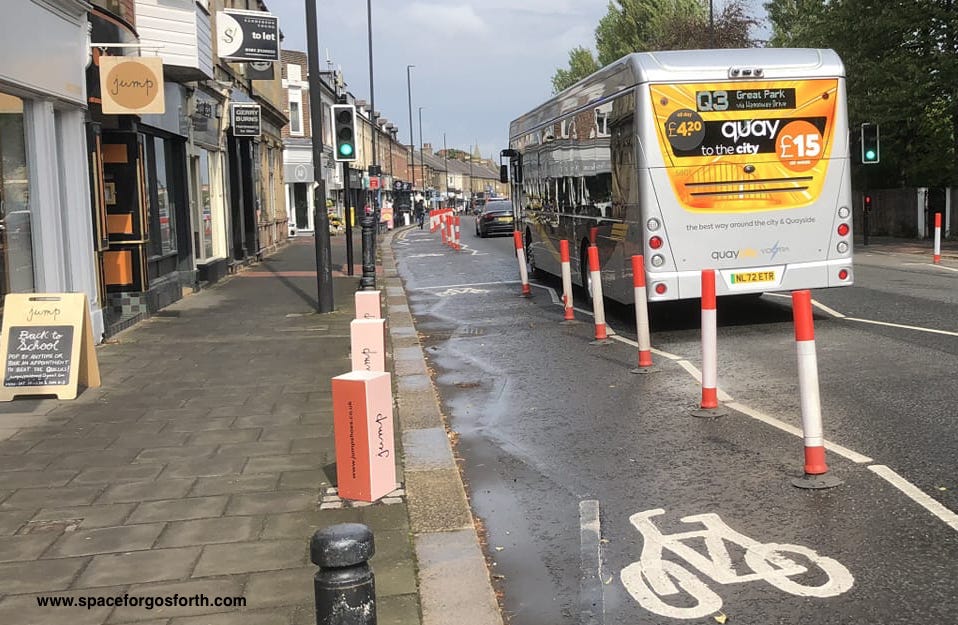
An electric bus and cycle lane on Gosforth High Street. Picture taken September 2022.
Air pollution at Haddricks Mill, 37.4μg/m3 in 2021, is broadly unchanged from previous years. This isn’t a bad result given traffic levels were suppressed during the Killingworth Road closure, but it should be much lower.
In the Chronicle article below, the Council said they aimed to cut pollution by “reducing congestion [and] by better managing the flow of vehicles at junctions” like Haddricks Mill. There isn’t good evidence that this approach will work. The Government’s own Air Quality Plan said about measures to optimise traffic flow that “there is considerable uncertainty on the real world impacts of such actions.“
Fears pollution levels will be dangerously high again at controversial Killingworth Roadhttps://t.co/eAJBUIAUOb
— The Chronicle (@ChronicleLive) June 4, 2019
Denton Burn
Like Gosforth, all the readings west of the city were also within legal limits, although Cowgate roundabout was very close to the limit.
Now the A1 Scotswood to North Brunton road widening has been completed (10 October 20222) roads leading to and from the A1 are likely to get busier as traffic increases due to induced demand from the additional capacity on the A1.
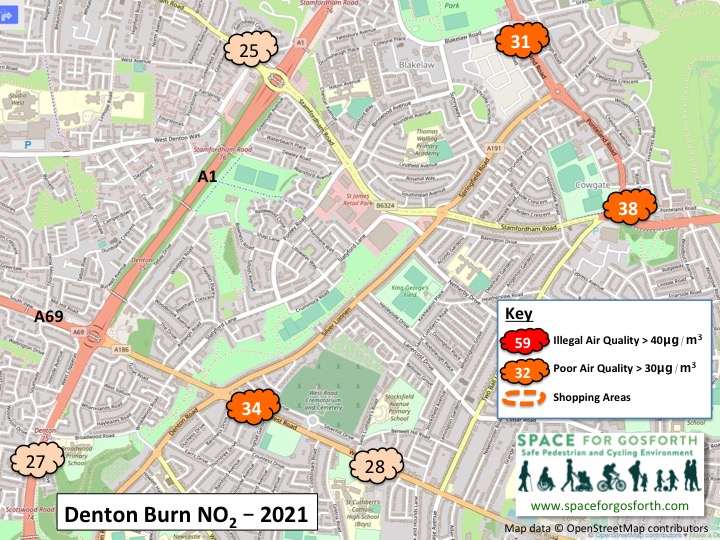
Denton Burn air pollution readings
The Clean Air Zone
The Clean Air Zone (CAZ) is now due to come into force from January 2023, so it is possible that two years from now we might finally have some good news – eighteen years after UK Air Quality Limits should have been met in Newcastle!
This Government’s Air Quality Technical Guidance states that charging the most polluting vehicles is one of the most effective ways to reduce pollution, so the CAZ is likely to be effective to cut pollution in the city centre.
Cleaner buses, taxis, vans and HGVs will also benefit roads outside the city centre, but we don’t know whether that will be sufficient for air quality, for example on Central Motorway or The Coast Road.
The table below shows the split of traffic on The Coast Road, St James’ Boulevard, Tyne Bridge and Gosforth High Street. As it shows, Gosforth High Street has the highest proportion of buses, HGVs and heavy vans so is likely to gain the most. Coast Road traffic is only 3-4% buses, HGVs or heavy vans so may not benefit as much.
| Location | Cars* | Heavy Vans | Buses & HGVs |
| Coast Road | 97% | 3% | 1% |
| St James’ Boulevard | 94% | 5% | 1% |
| Tyne Bridge | 93% | 4% | 2% |
| Gosforth High Street | 88% | 8% | 6% |
* “cars” includes taxis and light vans.
We hope the Council will be able to release air pollution monitoring data sooner in future, so that we can find out quickly what impact the CAZ has had.
SPACE for Gosforth has previously summarised official air pollution measurements for 2020, 2019, 2018, 2017 and 2016.
Still the obsession with the High Street. What about the other main routes into Newcastle that are now more polluted than ever?
I spent several days in early January taking readings on Kenton Road with university equipment borrowed from a study being undertaken by Aare Puussaar. The feedback I received was their was some really high readings. Then it appears the funding ran out and he moved on to other things. I assume the data has now been lost. It would be good if this could be revisited and the focus on Gosforth widened to include more than than the High Street.
We have just reported where the Council measurements are, and in Gosforth that’s on the High Street and by Haddricks Mill.
It would be surprising if Kenton Road had the same levels of pollution as the High Street. The High Street has multiple traffic lights, a large number of buses and HGVs, and is quite narrow in places. None of that is the case on Kenton Road.
Getting some measurements would be good though. If you do have access to any please do share them.